Characterization on the Beam Profile for Defect Detection of Unidirectional CFRP Composites Using NDE Techniques
Abstract
Nondestructive evaluation (NDE) technology has garnered interest as an inspection tool in various industries. In this study, ultrasonic technology was applied to the defect monitoring of carbon fiber reinforced plastic (CFRP) composite materials. By using ultrasonic technology, major ultrasonic reflection signals were observed in sequential order for defect evaluation in unidirectional composites. As ultrasonic waves propagate through the unidirectional CFRP composite, mode conversion, attenuation, and scattering results in a relative decrease in the peak-to-peak amplitude of the reflected ultrasonic signals, indicating the presence of defects. In the pitch-catch mode, three to four ultrasonic reflection signals were observed, and by implementing the beam profile of the reflected signals, we confirmed that the signal-to-noise ratio can be utilized as a key parameter for NDE by providing an effective scanning range of ultrasonic amplitudes.
Keywords:
NDE techniques, Defect detection, Beam profile, CFRP composites, Wind turbine blades1. Introduction
Recently, there has been a great interest in advanced composite materials that possess excellent mechanical properties, lightweight characteristics, and heat resistance as part of energy conservation and new material development efforts. Particularly, in the context of renewable energy, wind turbine blades are being manufactured using composite materials with superior stiffness (elastic modulus/strength) and specific strength (tensile strength/density). Specifically, carbon fiber-reinforced plastics (CFRP) are employed for light- weighting large wind turbine blades[1,2]. At this time various processes are involved in blade manufacturing. To ensure the stability and reliability of wind turbine blades, they need to be endowed with functionality that meets requirements such as aging resistance, oxidation resistance, waterproofing, anti- icing, fire resistance, and electromagnetic shielding. The CFRP composites, as a key material in the industry, are being utilized in various sectors including automotive, aerospace, marine, and machinery, where painting operations are required[3-5].
Wind turbine blades are composed of various components. In particular, the spar caps, which are core components in the blades, are evaluated for the characteristics and defects of unidirectional carbon fiber-reinforced composites using ultrasonic techniques[6-12]. It is crucial to perform non-destructive ultrasonic testing and evaluation of the internal fibers, resin characteristics, and hidden defects within unidirectional CFRP test specimens to obtain fundamental design data. CFRP composite specimens are manufactured for ultrasonic experiments, applying the pitch-catch mode using ultrasonic transducers according to the fiber orientation. Rayleigh wave transducers are used, enabling both unidirectional and bidirectional measurements in the pitch-catch mode, as well as adjustable measurement depths according to the desired depth of the specimen[13-14].
In this study, the fiber orientation of unidirectional CFRP composite laminates was quantitatively evaluated using a pitch-catch ultrasonic testing method. By assessing the presence of defects within the unidirectional CFRP composite, a more systematic and quantitative evaluation technique for ultrasonic behavior was developed and multiple ultrasound reflection signals were detected. So beam profiles were obtained by analyzing multiple ultrasound reflection signals. At this time by using the pitch-catch ultrasonic testing method the vertical and horizontal fiber orientations was analyzed based on the vertical and horizontal fiber orientations for finding the presence of defects in both unidirectional and bidirectional configurations. The beam profiles of the pitch-catch ultrasonic method provided insight into the behavior of the ultrasound, and the desired measurement depth could be achieved by adjusting the distance of the ultrasound probe using the pitch-catch method. In evaluating defects within the unidirectional CFRP composite, the major three ultrasound reflection signals were compared sequentially in the vertical fiber orientation, allowing for the identification of ultrasound reflection signals affected by defects. The propagation of ultrasound within the unidirectional CFRP composite for wind turbine blade applications was influenced significantly by mode conversion, attenuation, and scattering. Particularly, under the pitch-catch mode, selecting an ultrasound amplitude range with a high signal-to-noise ratio from the ultrasound reflection signals demonstrated its potential as a key parameter in NDE evaluations.
2. Ultrasonic system
2.1 Unidirectional CFRP specimen
In this experiment, test specimens were fabricated by stacking multiple carbon fiber prepregs, composed of carbon fiber/epoxy resin (CF/EPOXY), using a hydraulic press to create unidirectional CFRP laminates. The carbon fibers used had a diameter of 7 μm, and the types of test specimens according to the orientation of the carbon fibers are presented in Table 1. In this case, the CFRP composite laminates were produced by stacking unidirectional carbon fiber prepreg sheets, combined with CF/EPOXY, and utilizing a hydraulic press device. At this time, the density of carbon fiber is 1.75×10^3 (kg/m^3), with a tensile strength of 3.53 GPa and an elastic modulus of 230 GPa. Additionally, the density of epoxy resin is 1.24×10^3 (kg/m^3), with a tensile strength of 0.078 GPa and an elastic modulus of 3.96 GPa.
2.2 Experimental apparatus
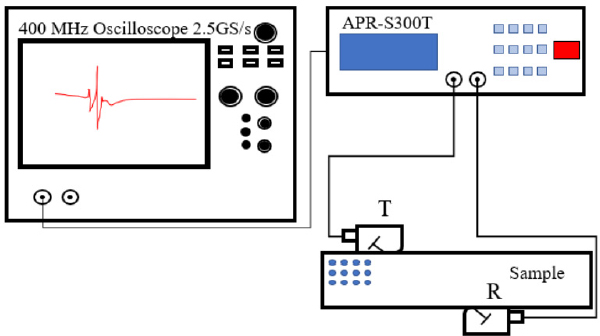
Fig. 1 is the device required for the ultrasonic experiment, where Fig. 1 is a schematic of the ultrasonic testing apparatus, which shows the overall ultrasonic testing device. The ultrasonic testing method utilized a direct Rayleigh ultrasonic probe, and ultrasonic waves were generated using the APR-S300T PR spike voltage pulser/receiver from AIQS. The RF waveform caused by the test specimen was obtained using an oscilloscope (Wave Surfer 42Xs-A) and stored in a computer. Several echo waves in the oscilloscope can be independently moved and measured by storing and comparing the echo waves on the screen, making it very convenient.
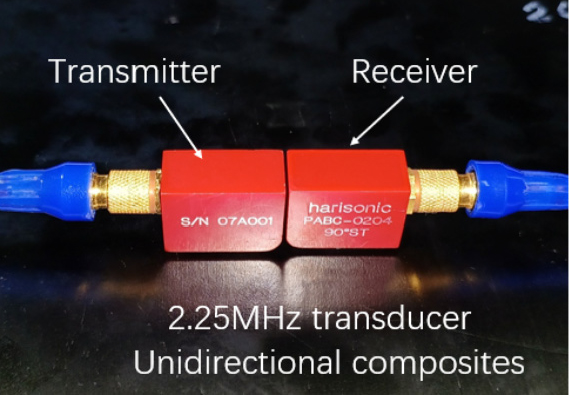
In this experiment, in order to maximize the ultrasonic signal, the Rayleigh ultrasonic probe, which consists of two ultrasonic probes, was used when the thickness of the CFRP composites are varied, and damping and scattering could be generated significantly in case of thicker plates. Therefore, a low frequency of 2.25MHz suitable for composite materials was used in this experiment. Fig. 2 shows the two probes used in the experiment, which are both 2.25 MHz Rayleigh ultrasonic probes (90°ST) from Harisonic Co..
2.3 Experimental methods
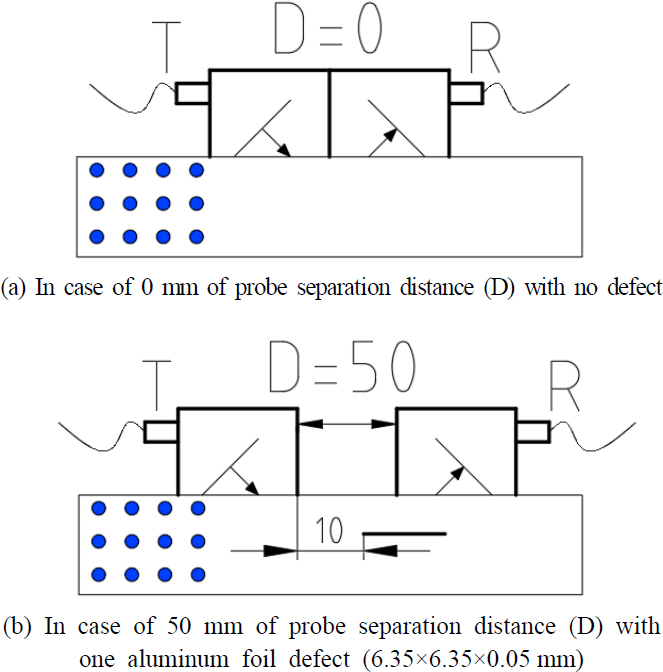
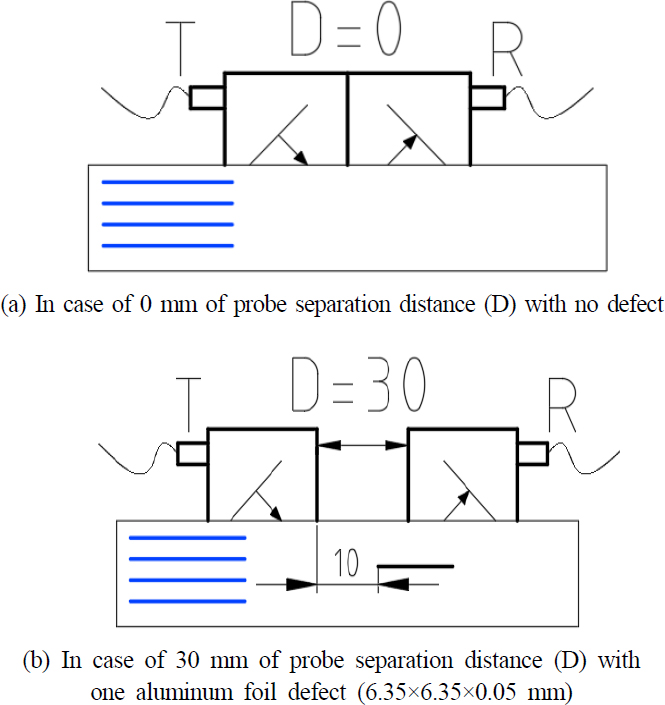
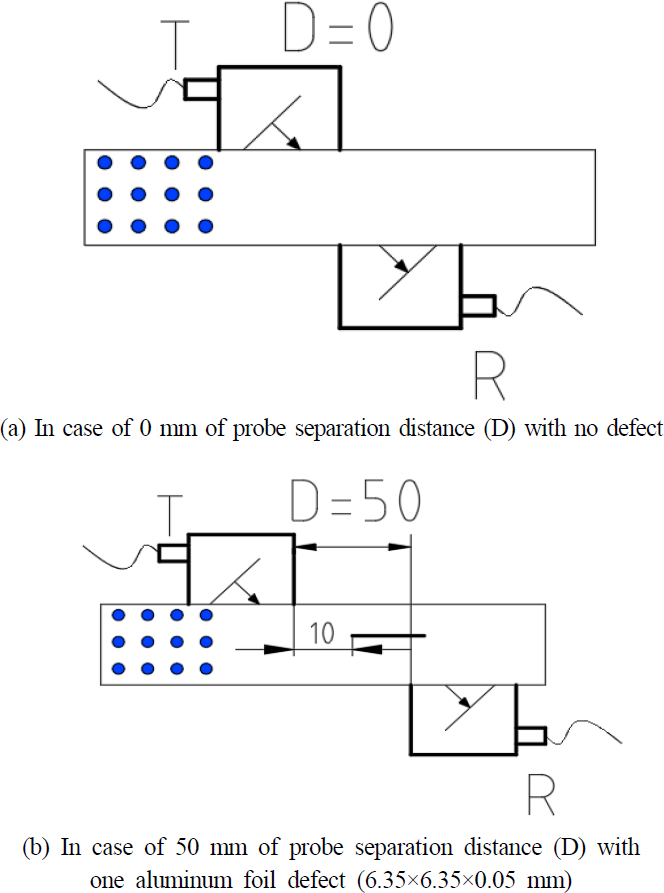
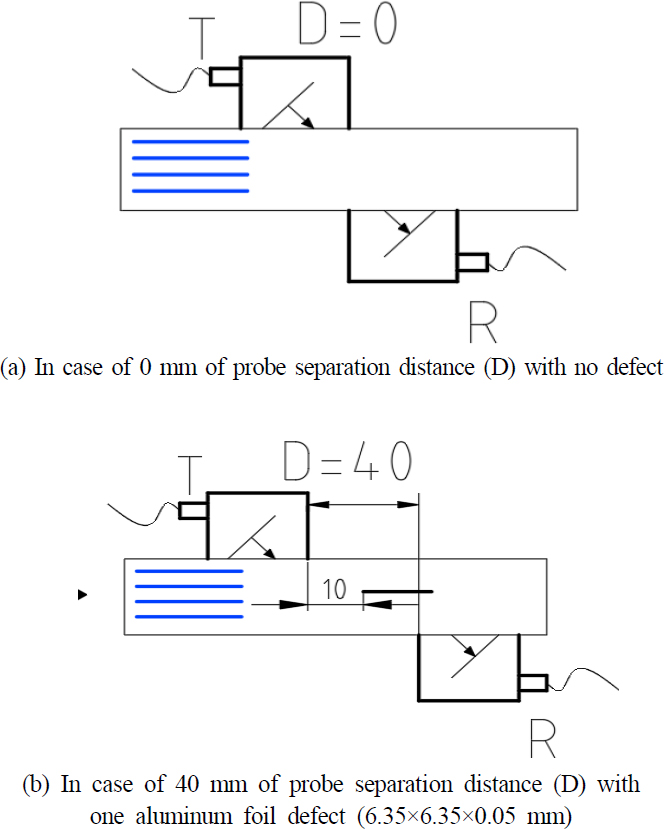
The experimental setup for the ultrasonic testing consisted of a digital storage oscilloscope (DSO) for digitizing the ultrasonic signals and performing PC data exchange (Lecory, Wave Surfer), a pulse-echo receiver (AIQS, APR-S300T) capable of transmitting and receiving data at a rate of 250,000 bits per second up to a distance of 1000 m, and a Rayleigh ultrasonic probe used as the transducer. In particular, as shown in Figs. 3-6, when using the pitch-catch mode with two ultrasonic probes on one side and both sides of the test specimen, the probe separation distance D could be adjusted. Specifically, Fig. 3(a) and Fig. 4(a) represent the case where D = 0 mm, while Fig. 3(b) and Fig. 4(b) illustrate the measurement method for D = 50 mm and 30 mm, respectively.
Fig. 3 depicts the measurement of ultrasonic signals in the normal-to-fiber direction (perpendicular to the fiber) of the CFRP composite during the ultrasonic testing. The transmitting transducer (T) was fixed, and the receiving transducer (R) was moved to acquire the signals. Fig. 3(a) represents the case without any defects, measured from one side of the specimen. Fig. 3(b) shows the case with D = 50 mm, where a defect (Aluminum foil: 6.35×6.35×0.05) was intentionally fabricated at the center of the test specimen. Ultrasonic testing was performed at every 2mm interval from D = 0 mm to D = 50 mm.
Fig. 4 illustrates the measurement of ultrasonic signals in the along-fiber direction of the CFRP composite during the ultrasonic testing. The transmitting transducer (T) was fixed, and the receiving transducer (R) was moved to acquire the signals. Fig. 4(a) represents the case without any defects, measured from one side of the specimen. Fig. 4(b) shows the case with D = 30 mm, where a defect was fabricated. In all signal measurements, ultrasonic testing was performed at every 2 mm interval from D = 0 mm to D = 30 mm.
The experimental setup for the ultrasonic testing consisted of a digital storage oscilloscope (DSO) for digitizing the ultrasonic signals and performing PC data exchange (Lecory, Wave Surfer), a pulse-echo receiver (AIQS, APR-S300T) capable of transmitting and receiving data at a rate of 250,000 bits per second up to a distance of 1000 m, and a Rayleigh ultrasonic probe used as the transducer. In particular, as shown in Figs. 3-6, when using the pitch-catch mode with two ultrasonic probes on one side and both sides of the test specimen, the probe separation distance D could be adjusted. Specifically, Fig. 3(a) and Fig. 4(a) represent the case where D = 0 mm, while Fig. 3(b) and Fig. 4(b) illustrate the measurement method for D = 50 mm and 30 mm, respectively.
Fig. 5 shows the signal measurement of CFRP composite material in the normal to fiber direction (normal to fiber⊥) during ultrasonic testing. The T (Transmitter) transducer, serving as the transmitting transducer, was fixed, while the R (Receiver) transducer, serving as the receiving transducer, was moved to acquire the signals. Fig.5(a) represents the case without any defects, measured from both sides. Fig.5(b) represents the case with a defect of D = 50, where a defect was introduced inside the test specimen. In all signal measurements, ultrasonic testing was performed at 4mm intervals from D = 0 to D = 50.
Fig. 6 shows the signal measurement of CFRP composite material in the along fiber direction (along fiber =) during ultrasonic testing. The T (Transmitter) transducer was fixed, while the R (Receiver) transducer was moved to acquire the signals. Fig. 6(a) represents the case without any defects, measured from both sides. Fig. 6(b) represents the case with a defect of D = 40, where a defect was introduced inside the test specimen. Ultrasonic testing was performed at every 2 mm interval from D = 0 mm to D = 30 mm.
3. Experimental results and discussion
3.1 Pitch-catch mode analysis
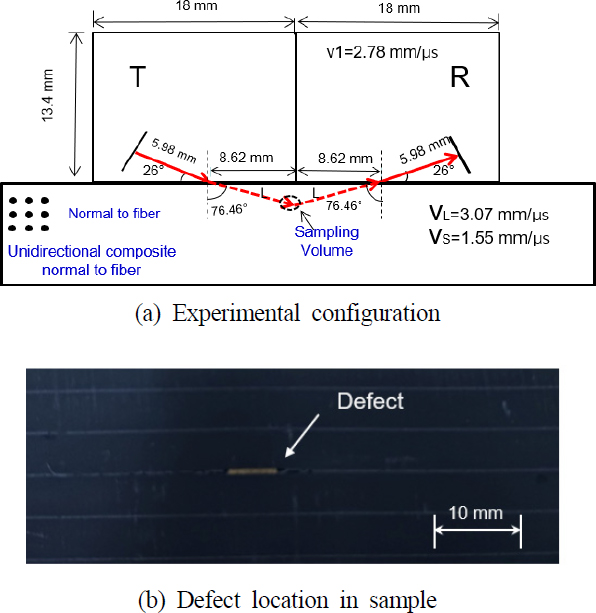
Fig. 7 represents the direction and defect location of ultrasound propagation in a rail-based probe used in pitch-catch mode. Pitch-catch mode measurements are highly useful when performing unidirectional testing[14]. Fig. 7 illustrates the direction of the wave generated when there is no gap (skip) between the transmitting probe T and the receiving probe R on one side of a CFRP laminate plate, as well as the probe configuration. To generate ultrasound in the test specimen, a coupling medium is required. The “sampling volume” in Fig. 7 can be calculated using the time-of-flight at any arbitrary depth in the test specimen. The pitch-catch signal is captured with an increase in the gap (skip) between the two probes. Two rail-based ultrasonic probes were used for this purpose. By considering the angle of the transducer and the material properties from these two probes, the ultrasound velocity, as well as all transformations, can be easily predicted, thereby determining the direction of ultrasound propagation.
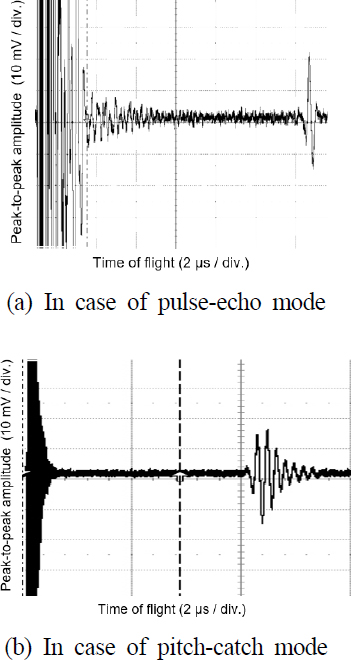
Fig. 8 compares the ultrasound signals obtained using pulse-echo mode and pitch-catch mode with a 2.25 MHz frequency ultrasound probe[14]. In Fig. 8(a), the B-scan image shows a significant amount of backscattered signals, which can be attributed to the reflections from the fibers in the unidirectional CFRP laminate plate. However, in Fig. 8(b), only the ultrasound signals reflected within the aforementioned “sampling volume” are visible, without the influence of other signals. This is due to the characteristic of the ultrasound probe being positioned at arbitrary angles, allowing for the acquisition of only the reflected signals within the “sampling volume”.
3.2 Vertical fiber direction
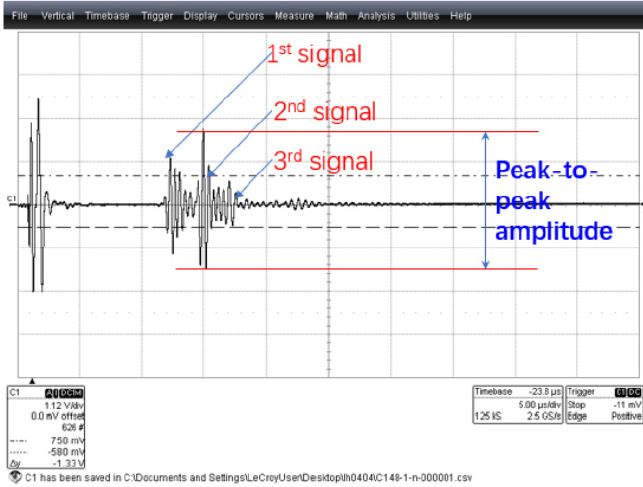
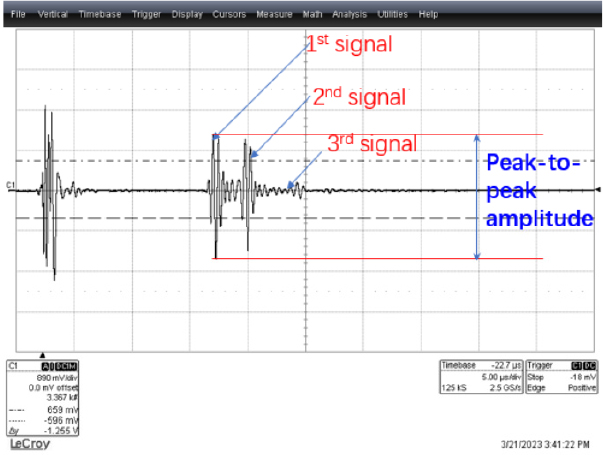
Fig. 9 illustrates the ultrasonic probe, specifically the Rayleigh ultrasonic probe, employed on a unidirectional CFRP composite laminate for wind turbine blades, with the ultrasound probe oriented perpendicular to the fibers in the unidirectional ply and utilizing the unidirectional pitch-catch mode. In particular, Fig. 9 represents the amplitude of the ultrasound signal in the unidirectional pitch-catch mode for a 48-ply CFRP composite laminate. In this case, typically 3-4 peak signals can be observed, with the time-of-flight (TOF) and amplitude measured at every 2 mm interval. Additionally, the distance “D” between the two ultrasound probes, known as the probe separation distance, was adjusted from D = 0 to D = 50 mm, while measuring the time-of-flight and amplitude.
Ultrasonic signal of Rayleigh wave transducers based on one-sided pitch-catch mode normal to fiber (48 ply)
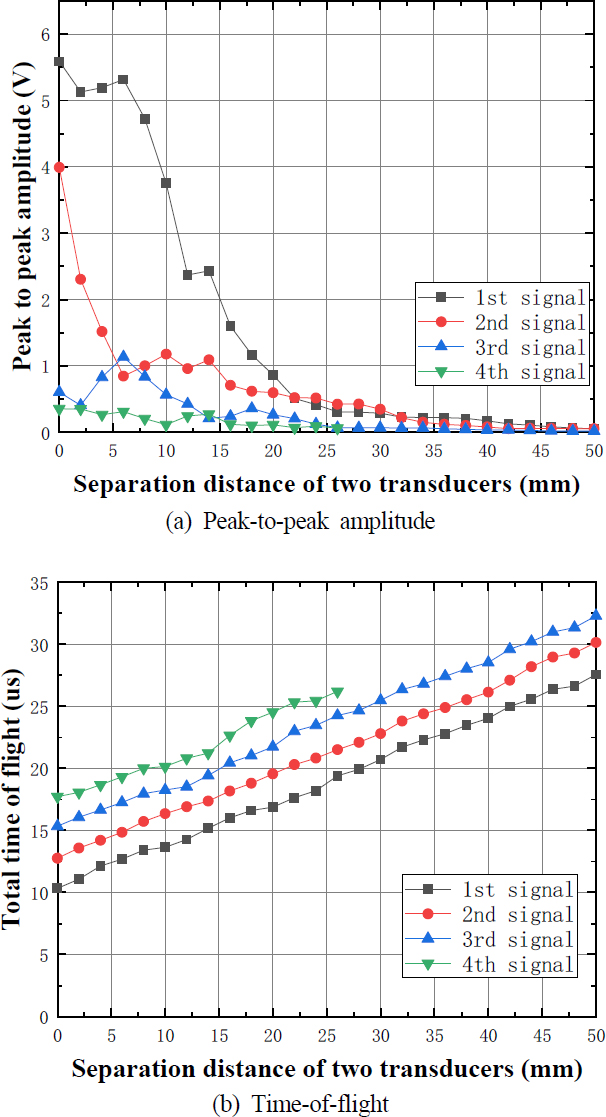
First, in Fig. 10(a), the X-axis represents the distance between the two ultrasonic probes, while the Y-axis represents the peak-to-peak amplitude. In Fig. 10(b), the X-axis represents the distance between the two ultrasonic probes, while the Y-axis represents the time-of-flight (TOF) of the ultrasound. Fig. 10 was obtained by conducting ultrasonic testing on a 48-ply unidirectional CFRP composite laminate, with no defects detected within the test specimen, and measuring the signal in the unidirectional direction. Fig. 10(a) shows three separate ultrasound signals corresponding to the distance between the ultrasonic probes and the peak-to-peak amplitude. Fig. 10(b) illustrates the relationship between the distance between the ultrasonic probes and the time-of-flight (TOF) of the ultrasound. In Fig. 10(a), initially, three signals were prominently observed up to approximately D = 10mm, but beyond D = 20 mm, the magnitude of the third signal decreased. It was observed that the peak-to-peak amplitude decreases as the distance (D) between the ultrasonic probes increases due to attenuation. Particularly, within D = 10 mm, the first and second amplitudes of the ultrasound signal were significantly higher. Therefore, it can be concluded that by adjusting the distance (D) between the ultrasonic probes, ultrasound signals with a high signal-to-noise(S/N) ratio can be obtained within a specific sampling volume, and the beam profile behavior of each ultrasound signal can be understood. Fig. 10(b) represents the relationship between the distance (D) between the ultrasonic probes and the time-of-flight (TOF) of the ultrasound. As the distance between the ultrasonic probes increases, the TOF also increases. This phenomenon occurs due to the increased ultrasound propagation distance.
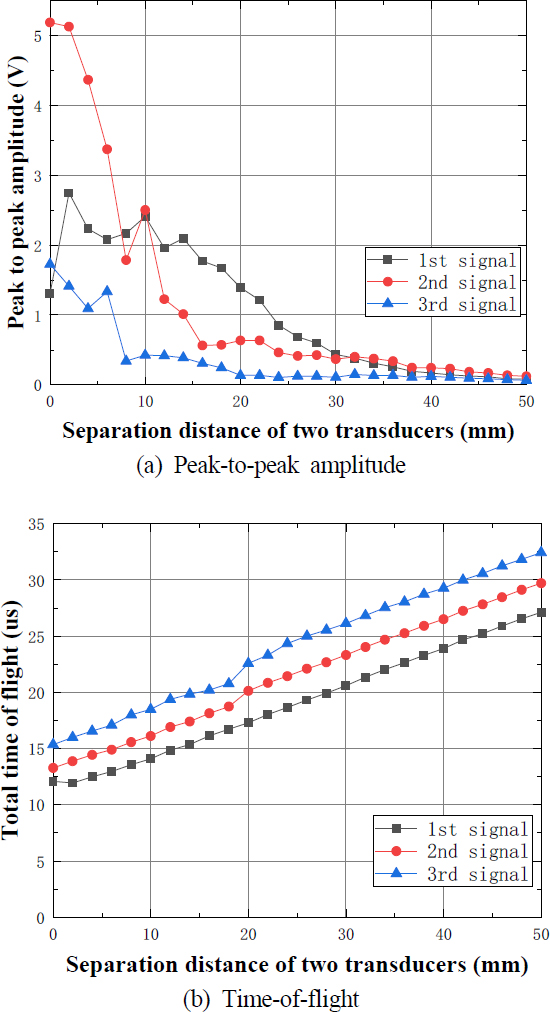
Peak to peak amplitude (a) and time-of-flight (b) of pitch-catch signal in one-sided beam profile experiment on 48 ply CFRP laminate without defects
First, in Fig. 11, a 48-ply unidirectional CFRP composite material was used during the ultrasonic testing. Defects were artificially introduced inside the test specimen, and the signals were measured from the unidirectional side. Fig. 11(a) represents the ultrasonic probe distance and peak-to-peak amplitude of three ultrasonic signals. Fig. 11(b) illustrates the relationship between the ultrasonic probe distance and time-of-flight (TOF). In Fig. 11(a), the second signal appeared prominently up to approximately D = 5 mm, while around D = 20, the first signal exhibited a slightly larger magnitude.
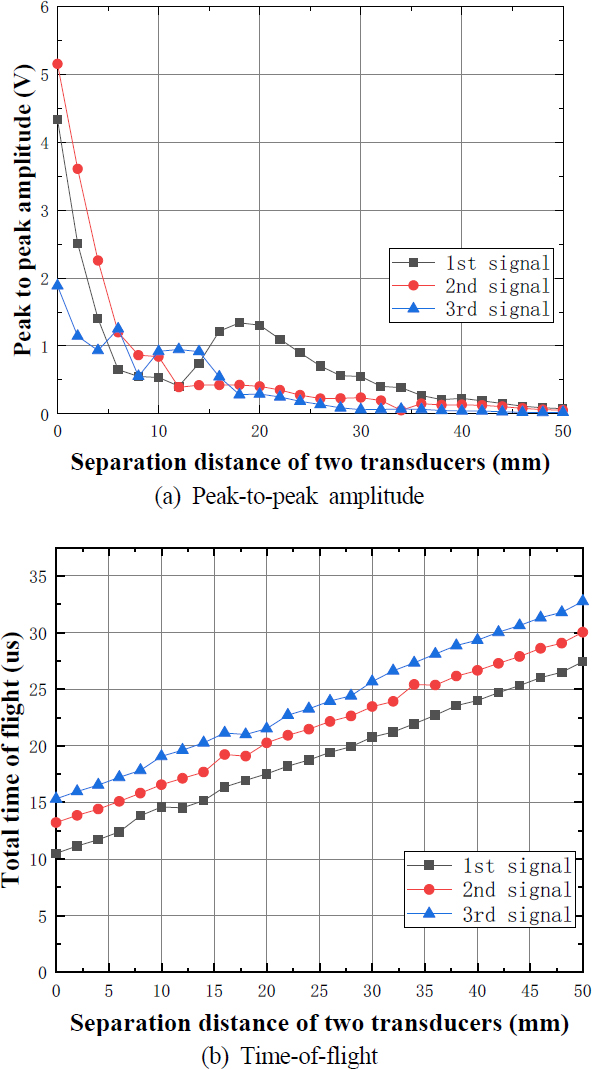
Peak to peak amplitude (a) and time-of-flight (b) of pitch-catch signal in one-sided beam profile experiment on 48 ply CFRP laminate with defect
By comparing Figs. 10 and 11, it can be observed that the ultrasonic testing conditions were the same, except for the presence of defects. In Fig. 10, both the first and second ultrasonic signals appeared significantly larger up to D = 20 mm, whereas in Fig. 11, the ultrasonic signals appeared relatively smaller. This suggests that the defects inside the test specimen affected the ultrasonic signals. Particularly, it is believed that the first signal was greatly influenced, and around D = 20 mm, the amplitude resembled that of a defect-free test specimen. Fig. 11(b) represents the relationship between the ultrasonic probe distance (D) and time-of-flight (TOF), showing that as the ultrasonic probe distance and each ultrasonic signal increase, the TOF also increases. In particular, the ultrasonic signal of CFRP composite material is clearly reflected into three distinct peaks especially in the vertical fiber direction. This is influenced due to the isotropic nature properties of unidirectional composite materials. Furthermore, the large peak-to-peak amplitude could represent a significant parameter that plays a role in effective defect detection during ultrasonic inspection.
First, Fig. 12 used a unidirectional CFRP composite material laminated with 48 plies during ultrasonic testing, and no defects were found inside the test piece. Signals were measured in both directions. Fig. 12(a) shows the distance of the ultrasonic probe and the peak-to-peak amplitude of four ultrasonic signals, and Fig. 12(b) shows the relationship between the ultrasonic probe distance and the flight time (TOF). In Fig. 12(a), first, two signals were significantly displayed up to D = 12 mm, and the signal size decreased somewhat beyond D = 20. Therefore, it was confirmed that the peak-to-peak amplitude value decreases due to attenuation as the distance (D) of the ultrasonic probe increases. In particular, the second ultrasonic signal was significantly displayed near D = 10 mm. Therefore, by adjusting the distance (D) of the ultrasonic probe, a high signal-to-noise ratio ultrasonic signal range can be obtained, and the overall behavior of the ultrasonic beam profile can be grasped in the bidirectional measurement mode. Fig. 11(b) shows the relationship between the distance (D) of the ultrasonic probe and the flight time (TOF), and as the distance and each ultrasonic signal increase, the flight time (TOF) also increases.
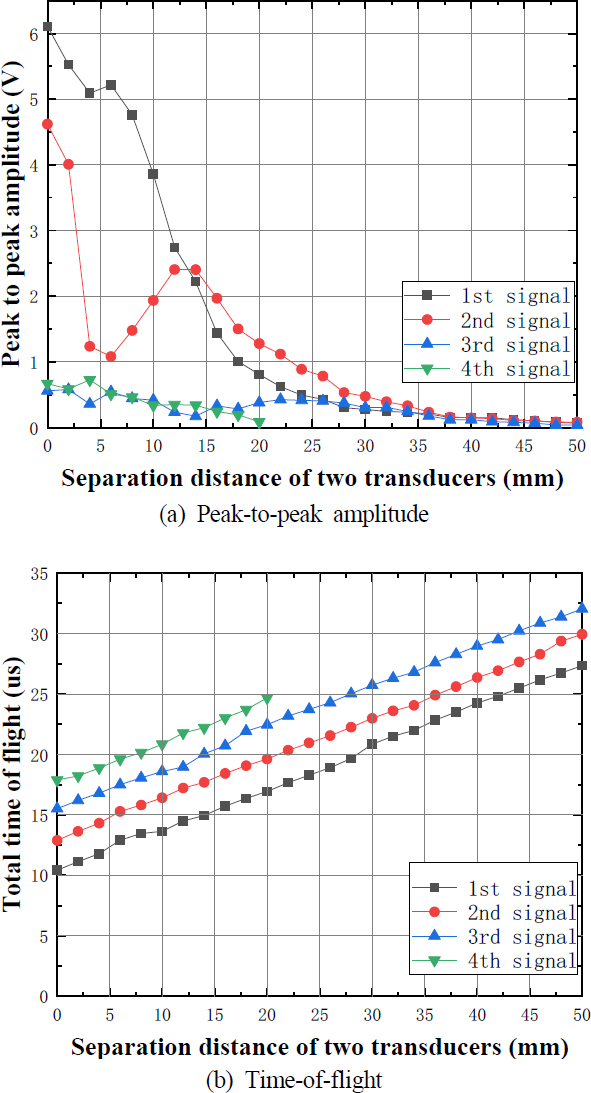
Peak to peak amplitude (a) and time-of-flight (b) of pitch-catch signal in two-sided beam profile experiment on 48 ply CFRP laminate without defects
First of all, as shown in Fig. 13, a unidirectional CFRP composite material stacked with 48 plies was used during ultrasonic testing, and defects were machined inside the test specimen. Signals were measured from both directions. Fig. 13(a) shows the distance of the ultrasonic probe and the peak-to-peak amplitude of each of the four ultrasonic signals. Fig. 13(b) shows the relationship between the distance of the ultrasonic probe and the flight time (TOF). Here, in Fig. 13(a), the first two signals were prominently displayed around D = 5 mm, but at D = 20 mm, the size of the first signal decreased significantly. The second signal showed a somewhat large size when D = 0 mm, but as D increased, the ultrasonic signal decreased dramatically. In particular, comparing Fig. 12 and Fig. 13, the ultrasonic test conditions were the same, but only the presence of defects differed. In Fig. 12, the first and second ultrasonic signals were generally prominent up to D = 20 mm, but in Fig. 13, the ultrasonic signal was relatively small, and the second ultrasonic signal decreased sharply. This is judged to be due to the effect of defects inherent in the test specimen. Fig. 13(b) shows the relationship between the distance (D) of the ultrasonic probe and the flight time (TOF), indicating that the flight time (TOF) increases as the distance of each ultrasonic signal and the ultrasonic probe increases.
3.3 Parallel fiber direction
First, ultrasonic testing was performed on a unidirectional CFRP composite laminate using a railhead ultrasonic probe with the probe parallel to the fibers and using the unidirectional pitch-catch mode. Specifically, in Fig. 14, the amplitude of the ultrasonic signal is shown for the unidirectional pitch-catch mode of a 48-ply CFRP composite laminate. In this case, three typical peak signals can be seen, and the flight time (TOF) and amplitude were measured. Additionally, measurements were taken while continuously controlling the “probe separation distance (D)” between the two ultrasonic probes.
Ultrasonic signal of Rayleigh wave transducers based on two-sided pitch-catch mode along fiber (48 ply)
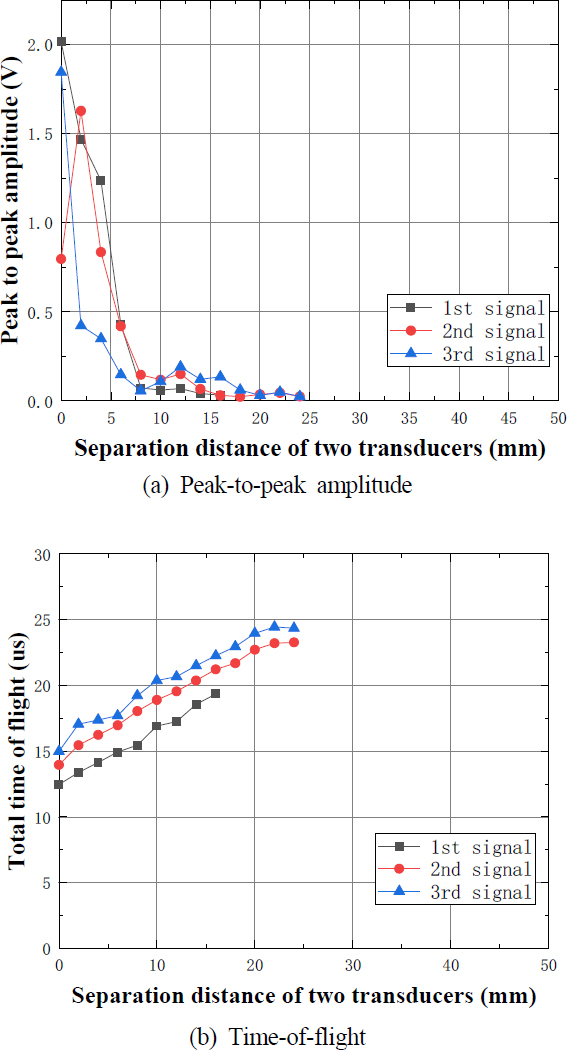
First, Fig. 15 was obtained using a 48-ply unidirectional CFRP composite laminate without any internal defects, and the measurements were conducted in the direction parallel to the fibers. Fig. 15(a) shows three ultrasonic signals representing the peak-to-peak amplitude as a function of the ultrasonic probe distance, while Fig. 15(b) illustrates the relationship between the ultrasonic probe distance and the flight time (TOF). The ultrasonic signals were measured only up to a distance of 20 mm, as the ultrasonic signal rapidly decreased beyond D = 20 mm.
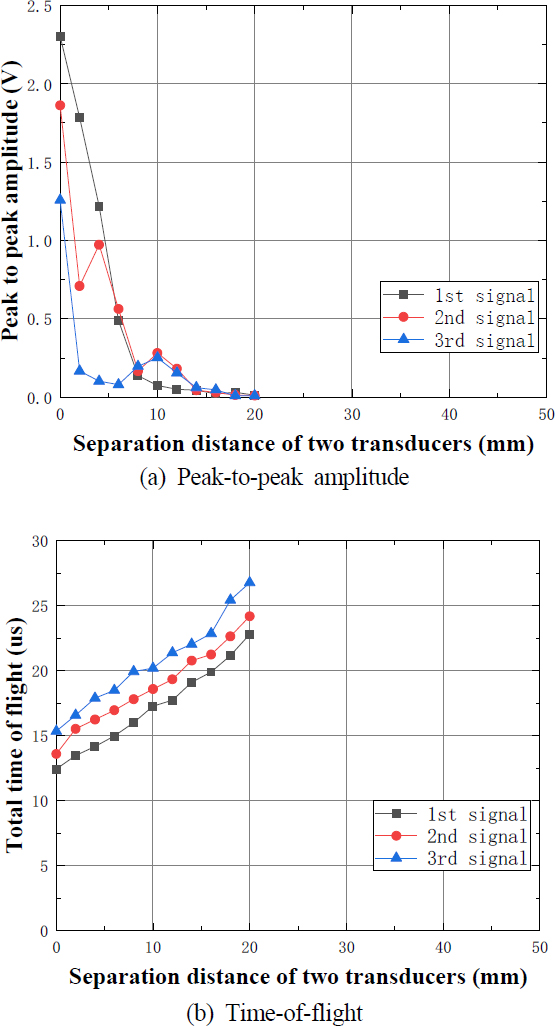
Peak to peak amplitude (a) and time-of-flight (b) of pitch-catch signal in one-sided beam profile experiment on 48 ply CFRP laminate without defects
From the results, it can be observed that the first and second signals were relatively larger within the ultrasonic probe distance of D = 7 mm, but the ultrasonic signals significantly decreased at distances of D = 12 mm and above. This suggests that the parallel fibers inside the test specimen had some influence. Therefore, it can be concluded that the range near D = 5 mm of the first and second signals is the region with a high signal-to-noise(S/N) ratio. Fig. 15(b) represents the relationship between the ultrasonic probe distance (D) and the flight time (TOF), showing an increase in TOF with the increase in both ultrasonic probe distance and ultrasonic signal.
First, Fig. 16 shows the relationship of amplitude and separation distance using unidirectional CFRP composite material with an inherent internal defect that was stacked with 48 plies, and the measurement method was conducted from the unidirectional direction to the parallel fiber direction. Fig. 16(a) represents three ultrasonic signals showing the distance of the ultrasonic probe and the peak-to-peak amplitude, and Fig. 16(b) shows the relationship between the ultrasonic probe distance and the time of flight (TOF). Since the ultrasonic signal exceeding D = 24mm decreased rapidly, only up to 24 mm was measured. Here, when the ultrasonic probe measurement distance was within D = 4 mm, the first and second signals were somewhat larger, but the ultrasonic signal decreased significantly from a distance of D = 7 mm or more. It is judged that this is because the parallel fibers inside the test specimen had some influence. In particular, comparing Figs. 15-16, the ultrasonic test conditions are the same, but only the presence or absence of defects is different. Fig. 12 showed that the first and second ultrasonic signals were generally large up to D = 10 mm, but Fig. 16 showed relatively small ultrasonic signals. It is judged that the internal defect of the test specimen interfered with the ultrasonic signal. Fig. 16(b) shows the relationship between the ultrasonic probe distance (D) and the time of flight (TOF), and as each ultrasonic signal and the ultrasonic probe distance increase, the time of flight (TOF) also increases.
First, Fig. 17 utilized a unidirectional CFRP composite with 48 plies and no internal defects. The measurements were conducted in the parallel fiber direction from both sides. Fig. 17(a) represents four ultrasonic signals with the distance of the ultrasonic probe and the peak-to-peak amplitude. Fig. 17(b) illustrates the relationship between the distance of the ultrasonic probe and the flight time (TOF). The measurements were only performed up to 14 mm due to a rapid decrease in the ultrasonic signal beyond D = 4 mm. This suggests that parallel fibers inside the test specimen had some influence. Therefore, the range of the first and second signals near D = 4 mm is considered to have a high signal-to-noise ratio. Fig. 15(b) demonstrates the relationship between the distance of the ultrasonic probe (D) and the flight time (TOF), confirming a relatively stable increase as the distance of the ultrasonic probe increases.
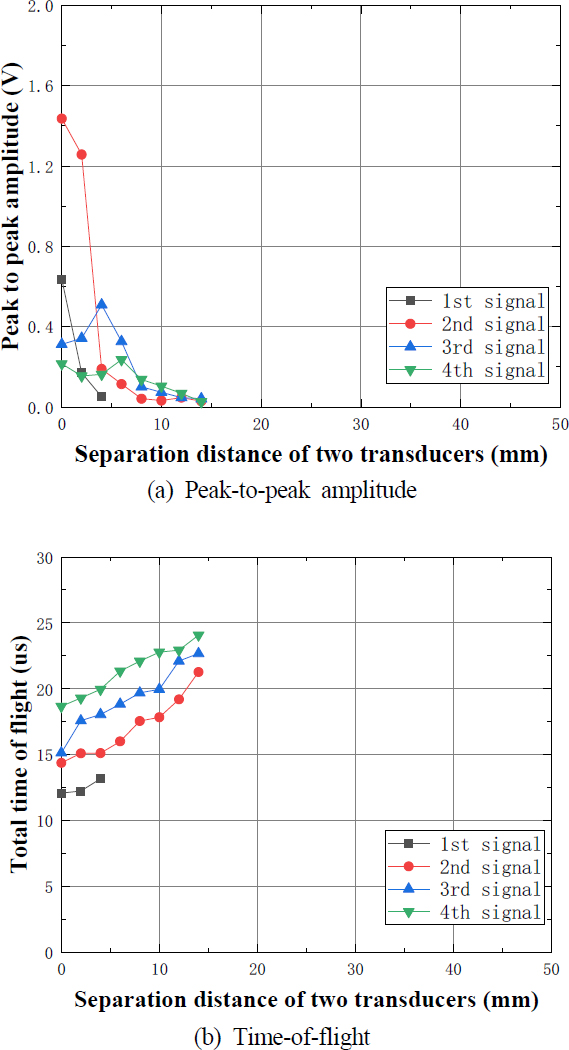
Peak to peak amplitude (a) and time-of-flight (b) of pitch-catch signal in two-sided beam profile experiment on 48 ply CFRP laminate without defects
First, Fig. 18 utilized a unidirectional CFRP composite with 48 plies and internal defects. The measurements were conducted in the parallel fiber direction from both sides. Fig. 18(a) represents three ultrasonic signals with the distance of the ultrasonic probe and the peak-to-peak amplitude. Fig. 18(b) illustrates the relationship between the distance of the ultrasonic probe and the flight time (TOF). The measurements were only performed up to 20 mm due to a rapid decrease in the ultrasonic signal beyond D = 4 mm.
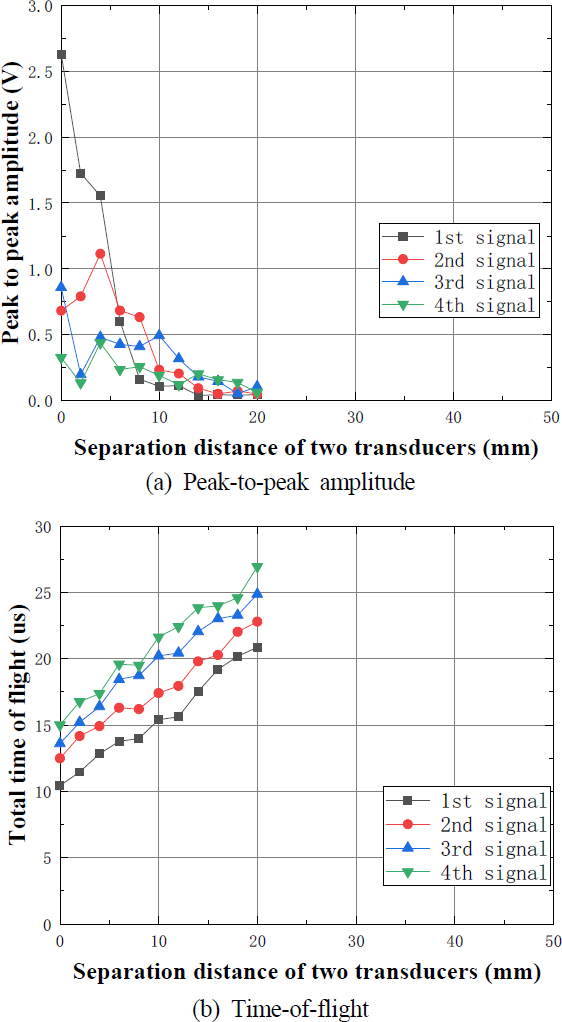
Peak to peak amplitude (a) and time-of-flight (b) of pitch-catch signal in two-sided beam profile experiment on 48 ply CFRP laminate without one defect
Within the distance range of D = 4 mm, the first and second signals exhibited relatively large amplitudes, but beyond D = 12 mm, the ultrasonic signal significantly decreased. This suggests that the parallel fibers inside the test specimen had some influence.
In particular, when comparing Fig. 17 and Fig. 18, the ultrasonic testing conditions were the same, but only the presence of defects differed. Fig. 17 showed generally large amplitudes for the first and second ultrasonic signals up to D = 4 mm, while Fig. 18 exhibited relatively smaller ultrasonic signals. This indicates that the internal defects in the test specimen interfered with the ultrasonic signals.
Fig. 18(b) demonstrates the relationship between the distance of the ultrasonic probe (D) and the flight time (TOF), showing an increase in TOF as the distance of the ultrasonic probe and the corresponding ultrasonic signal amplitude increase.
3.4 Defect detection
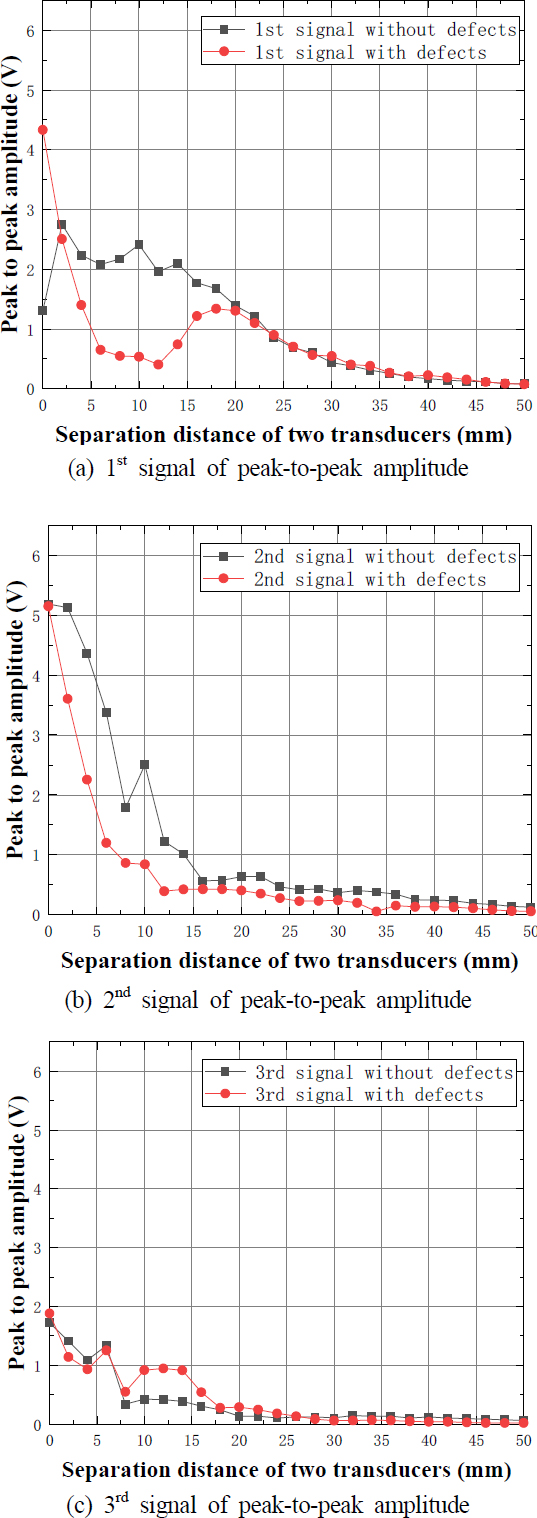
First, the ultrasonic peak signals were compared in order to determine the presence of defects within the 48-ply laminated unidirectional CFRP composite. Additionally, the amplitude signals and transit time for the ultrasonic method and probe distance were analyzed by selecting the ultrasonic probe that exhibited the greatest variation. In Figs. 10 and 11, the ultrasonic amplitude sizes were presented for each peak order under unidirectional testing conditions as shown in Fig. 19. In Fig. 19(a), the first peak amplitude signals were compared, illustrating the relationship between ultrasonic probe distance and amplitude. The ultrasonic test data represented by a symbol of “◼” indicates the absence of defects, while the data represented by a symbol of “” indicates the presence of defects. Initially, the two sets of data matched, but a significant difference was observed around 10 mm. This suggests that the defects inherent within the test specimen impeded the direction of the ultrasonic waves, leading to the observed difference. Furthermore, in Fig. 19(b), a significant difference in ultrasonic probe distance was observed around 5-10 mm, while in Fig. 19(c), the difference between the two sets of data was not significant.
4. Conclusions
In this study, ultrasound technology was applied to the defect monitoring of CFRP (carbon fiber reinforced plastics) composite materials, which are used as inspection tools in industrial production areas. The technology was utilized to evaluate the defects in unidirectional CFRP laminates used as spar caps for wind turbine blades. Qualitative evaluation of internal defects in the composite material was performed using the ultrasound pitch-catch method, specifically the Rayleigh wave ultrasonic testing device. Key findings from the study are as follows:
1) It is confirmed that the pitch-catch method could be adopted as effective techniques due to relatively fewer reflections on detecting defects in composite materials.
2) By using the ultrasound pitch-catch method and adjusting the distance of the ultrasound transducer, the desired measurement depth of the test specimen could be controlled.
3) To evaluate the fiber orientation in the unidirectional CFRP composites of wind turbine blade spar caps, the effective ranges of high signal-to-noise(S/N) ratio in the ultrasound beam profile could be selected as approximately 20 mm in the unidirectional vertical fiber direction and approximately 10 mm in the unidirectional parallel fiber direction.
4) The three reflection signals of ultrasound waves were compared in order from the unidirectional and bidirectional vertical fiber directions to evaluate defects in unidirectional CFRP composites. It is confirmed that the presence of defects within CFRP composites could affect the ultrasound reflection signals.
5) Under the pitch-catch mode in the unidirectional CFRP composites, 3~4 ultrasound reflection signals could be observed, and the beam profile of the reflection signals could provide a key parameter for non-destructive evaluation (NDE) by utilizing the ultrasound amplitude range with a high S/N ratio.
Acknowledgments
This research was supported by the Basic Science Research Program through the National Research Foundation of Korea (NRF) (No.2021R1I1A3042195) and also was supported by “Regional Innovation Strategy (RIS)” through the National Research Foundation of Korea(NRF) funded by the Ministry of Education(MOE)(2023RIS-008)
References
- Im, K. H., Zhang, G. L., Choi, S. R., Ye, C. H., Ryu, J. S., Lim, S. H., Han, M. G., Hsu, D. K., 2011, One-sided Nondestructive Evaluation of CFRP Composites By Using Ultrasonic Sound, J. Korean Soc. Precis. Eng., 20:1 47-52.
-
Zhang, G. L., Yeom, Y. T., Kim, S. K., Cho, Y. T., Woo, Y. D., Im, K. H., 2022, Evaluation of NDE Characteristics for Measuring the Painting Thickness in Wind Energy Turbine Power Blades Based on Ultrasonic Wave Simulation, J. Korean Soc. Manuf. Technol. Eng., 31:3 154-161.
[https://doi.org/10.7735/ksmte.2022.31.3.154]

-
Ji, H., Kim, D. H., Park, H. J., Lim, H. M., Lee, S. H., Kim, D. S., Kim, Y. H., 2014, Preparation of Alumina-silica Composite Coatings by Electrophoretic Deposition and their Electric Insulation Properties, J. Korean Ceram. Soc., 51:3 177-183.
[https://doi.org/10.4191/kcers.2014.51.3.177]

-
Im, K. H., Lee, K. S., Yang, I. Y., Yang, Y. J., Seo, Y. H., Hsu, D. K., 2013, Advanced T-ray Nondestructive Evaluation of Defects in FRP Solid Composites, Int. J. Precis. Eng. Manuf., 14 1093-1098.
[https://doi.org/10.1007/s12541-013-0147-2]

-
Im, K. H., Kim, S. K., Woo, Y. D., Cho, Y.T., Lee, G. S., Yu, Y. M., Jung, J. A., Zhang, G. L., 2017, NDE Terahertz Techniques for Measurement of Paint Thickness on Blades for Use in Wind Power, J. Korean Soc. Manuf. Technol. Eng., 26:6 610-616.
[https://doi.org/10.7735/ksmte.2017.26.6.610]

- Jeong, J. A., Hsu, D. K., Im, K. H., 2011, One-sided Nondestructive Evaluation of Back-Side Wedge By using Ultrasonic Sound, J. Korean Soc. Manuf. Technol. Eng., 20:6 773-777.
- Goebble, K., 1980, Structure Analysis by Scattered Ultrasonic Radiation in Research Techniques in Nondestructive Testing Vol. 4 (ed. Sharpe, R. S.), 30-38, Academic Press, London.
- Hsu, D. K., Thompson, D. O., Thompson, R. B., 1986, Evaluation of Porosity in Aluminum Alloy Castings by Single-Sided Access Ultrasonic Backscattering in Review of Progress in Quantitative Nondestructive Evaluation: Volume 5 (ed. Thompson, D. O., Chimenti, D. E.,) 1633-1642, Plenum Press, NY.
-
Park, H. B., Kim, Y. K., 2019, A Study on Coating Film Thickness Measurement in Vehicle using Eddy Current Coil Sensor, J. Korea Inst. Inf. Commu. Eng., 23:9 1131-1138.
[https://doi.org/10.6109/jkiice.2019.23.9.1131]

-
Zhang, X., Augereau, F., Laux, D., Le Clezio, E., Ismaili, N. A., Kuntz, M., Despaux, G., 2014, Non-destructive Testing of Paint Coatings on Steel Plates by Ultrasonic Reflectometry, J. Nondestruct. Eval., 33 504-514.
[https://doi.org/10.1007/s10921-014-0246-8]

-
Mezghani, S., Perrin, E., Vrabie, V., Bodnar, J. L., Marthe, J., Cauwe, B., 2016, Evaluation of Paint Coating Thickness Variations based on Pulsed Infrared Thermography Laser Technique, Infrared Phys. Technol., 76 393-401.
[https://doi.org/10.1016/j.infrared.2016.03.018]

-
Kim, G. W., Seo. M. K., Choi, N. K., Kim, K. B., Kwon, S. K., Kim, Y. C., 2017, Development of Phased Array Ultrasonic Transducers for Detecting Defects of KR60 Rail Road (I) - Simulation by CIVA Software, J. Korean Soc. Nondestruc. Test., 37:6 411-417.
[https://doi.org/10.7779/JKSNT.2017.37.6.411]

-
Jang, H. L., Han, D. H., Kang, L. H., 2020, Thickness Measurement Method of the Paint Coating Layer Using THz-TDS System, J. Korean Soc. Nondestruc. Test., 40:4 259-265.
[https://doi.org/10.7779/JKSNT.2020.40.4.259]

-
Shia, X. L., Liang, H., Zhou, Z. H., Zhang, P., Zhang, G. L., Cho, Y. T., Woo, Y. D., Im, K. H., 2023, NDE Techniques of Fiber Characterization in Spar Caps of Wind Turbine Blades using Ultrasonic Waves, J. Korean Soc. Manuf. Technol. Eng., 32:3 119-128.
[https://doi.org/10.7735/ksmte.2023.32.3.119]


Ph. D. Candidate in the Department of Automotive Engineering, Graduate School of Woosuk University.
His research interest is NDE on Composites.
E-mail: rupipi@163.com

Ph. D. Candidate in the Department of Automotive Engineering, Graduate School of Woosuk University.
His research interest is NDE on Composites.
E-mail: shixiaolongycit@163.com

Ph. D. Candidate in the Department of Automotive Engineering, Graduate School of Woosuk University.
His research interest is NDE on Composites.
E-mail: 18632959996@163.com

Ph. D. Candidate in the Department of Automotive Engineering, Graduate School of Woosuk University.
His research interest is NDE on Composites.
E-mail: zhengbao1203@naver.com

An associate professor at the Dept. of Basic Science, College of Engineering, Jeonju University.
He is interested in Nondestructive Testing and Evaluation of Infrared Thermography and FEM Analysis.
E-mail: dgycho@hanmail.net

Assistant professor in Department of Smart Mechanical Components and Materials at Dongyang University.
His main research areas are Non-destructive Evaluation for Material Characteristicsc.
E-mail: ytyeom@dyu.ac.kr

A Full Professor in Dept. of Automotive Engineering at Woosuk University.
He is interested Nondestructive Testing and Analysis of Composite Materials and Semiconductors.
E-mail: wooyongd@woosuk.ac.kr

A Full Professor in Dept. of Automotive Engineering at Woosuk University.
He is interested in T-ray/UT Nondestructive Testing and Analysis of Composite Materials.
E-mail: khim@woosuk.ac.kr

