Optimal Shooting Distance Design for Mobile Water Monitor
Abstract
To ensure the safety of ships in the occurrence of fires at sea, the committee of Safety of Life at Sea (SOLAS) revised the regulation (MSC.1/Circ.1472) that contains the obligation of the installation of a mobile water monitor depending on the vessel size. This study proposes an optimal design technique for a mobile water monitor. In accordance with SOLAS regulations, the performance of the monitor is defined by carefully considering the design parameters of the monitor. To optimize these, in this study, two indices, namely, the performance and productivity, of a mobile water monitor were considered. To determine the monitor performance, a numerical analysis was conducted, where the productivity was considered as the production cost. The two induced indices were formulated as the function of the nozzle diameter and operating pressure; this function was optimized using the differential evolution algorithm.
Keywords:
Mobile water monitor, Optimization, Spray distance, Productivity, Differential evolution1. Introduction
Fire-based accidents are one of the most dangerous maritime accidents with diverse causes. Therefore, fundamental fire safety requirements are prescribed for vessels by every country and the International Convention for the Safety of Life at Sea (SOLAS) [1], which sets minimum safety standards in the construction, equipment, and operation of merchant ships. The National Transportation Safety Board (NTSB) determines the probable cause of accidents and issues safety recommendations aimed at preventing future accidents. In addition, the NTSB conducts special studies concerning transportation safety and coordinates resources of organizations. However, most fire extinguishing equipment is stationary on a vessel, and thus cannot be used to extinguish all types of fires. In light of this situation, the International Maritime Organization (IMO) recently amended the SOLAS convention to place mobile monitors on ships. According to IMO regulation MSC.1/Circ.1472, vessels carrying five or more stages of containers on deck are obligated to carry four sets of mobile monitors if their widths are ≥3 0 m and two monitor sets if their widths are < 30 m.
In terms of fire-extinguishing systems, studies have been conducted on the determination of locations for water deluge to handle fires at offshore installations and indoor fire-suppression robots [2]. Researchers have also proposed ship designs based on computational analysis by considering fire occurrence on ships, and the analyzed the extinguishing performance of water mist [3,4]. A buoyancy support system based on a fixed fire extinguishing system has been studied for fire damaged vessels [5,6]. Regarding the injection performance of related equipment, researchers have studied the injector nozzle [7,8] and the K-factor design of a spray nozzle based on temperature change [9]. Methods for analyzing the flow characteristics in the orifice tube have also been studied [10]. Regarding the form monitor, which has a similar working principle to that of the mobile monitor, researchers have analyzed the flow characteristics in the injection nozzle [11]. Although many relevant studies have been conducted, to date, there has been no active research on mobile water monitors. Therefore, in this paper, the authors propose an optimal design method for mobile water monitors by considering their performance and productivity.
In the amended SOLAS convention, a mobile monitor is required to emit sea water in the form of spray at a discharge pressure of 0.4 MPa with at least 40 m of horizontal spray distance. To design a mobile monitor by considering these design requirements, the diameter of the injection nozzle of the mobile monitor must be de-signed first to achieve the regulated performance.
This paper proposed an optimal nozzle shape for the mobile monitor based on the revised SOLAS regulation. The evaluation function for the optimal design considers the performance and productivity of the mobile monitor. To optimize the evaluation function, the differential evolution (DE) algorithm was applied.
2. Performance estimation model for mobile water monitor
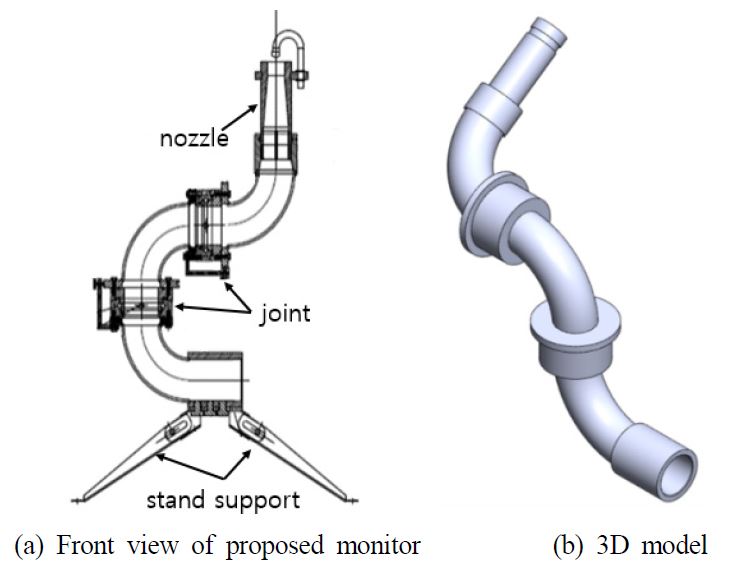
In the IMO convention, the maritime mobile monitor defines the ease of movement and spray range. Fig. 1 shows the proposed shape of the mobile monitor, which is designed so that the three supporting feet can be folded to increase the mobility. MSC.1/Circ.1472 requires a spray range of ≥40 m at a spray angle of 30° –35°. The nozzle diameter and pressure conditions of the monitor according to the regulation are shown in Table 1.
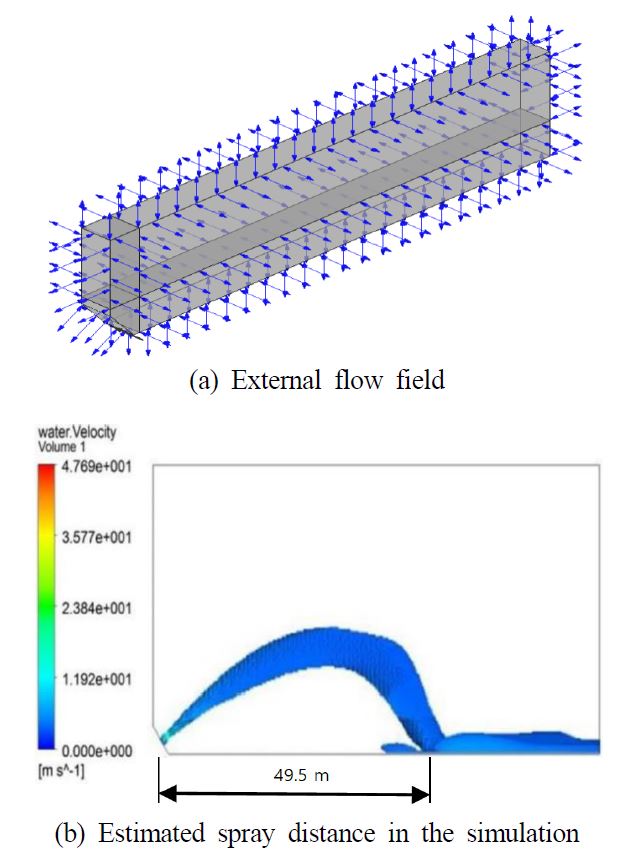
A computational flow analysis was performed to predict the ejection flow rate and spray distance of the proposed mobile water monitor by using ANSYS FLUENT, and CFD-Post was used for post-processing of the analysis data. The shear stress transport model was applied to the turbulence model for analyzing the flow. To analyze the flow rate of the mobile water monitor at the outlet and separation distance, an external flow field is required. In this analysis, the size of the flow field was set to 70 m in the injection direction, 20 m in the height direction, and 2 m in the width direction by considering the spray distance, as shown in Fig. 2(a). As the boundary condition for the flow analysis, water at room temperature was used as the fluid to be sprayed, and air at room temperature was used as the external flow field. Gravity conditions were specified for the entire flow field to provide the effect of the fluid dropping owing to gravity. The external flow field, which the fluid ejected through the outlet of the nozzle, considers the opening conditions, such as atmospheric conditions, and the bottom of the external flow field. The configuration information of the finite element model for the boundary conditions is shown in Tables 2 and 3.
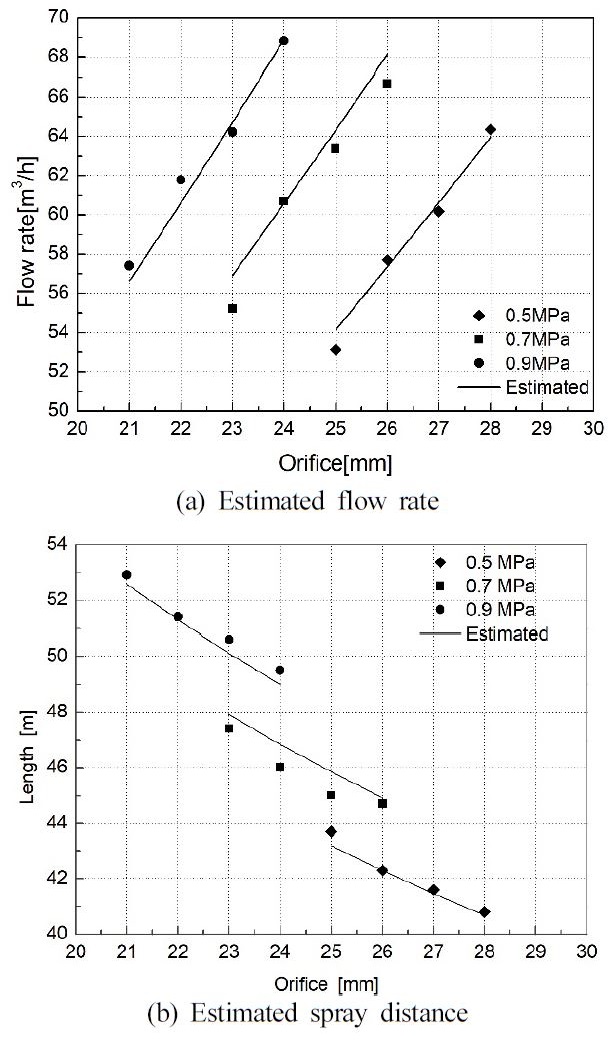
To estimate the spray distance, 12 simulations were performed according to different nozzle diameters and inlet pressure, as shown in Table 4. The simulation results are presented in Fig. 2 and 3. Based on the simulation results, the flow rate and spray distance were estimated as shown in Eq. (1). This proposed function has two input variables: nozzle diameter and operating pressure, which were defined using the nonlinear curve fitting algorithm. The fitted parameters are shown in Table 5.
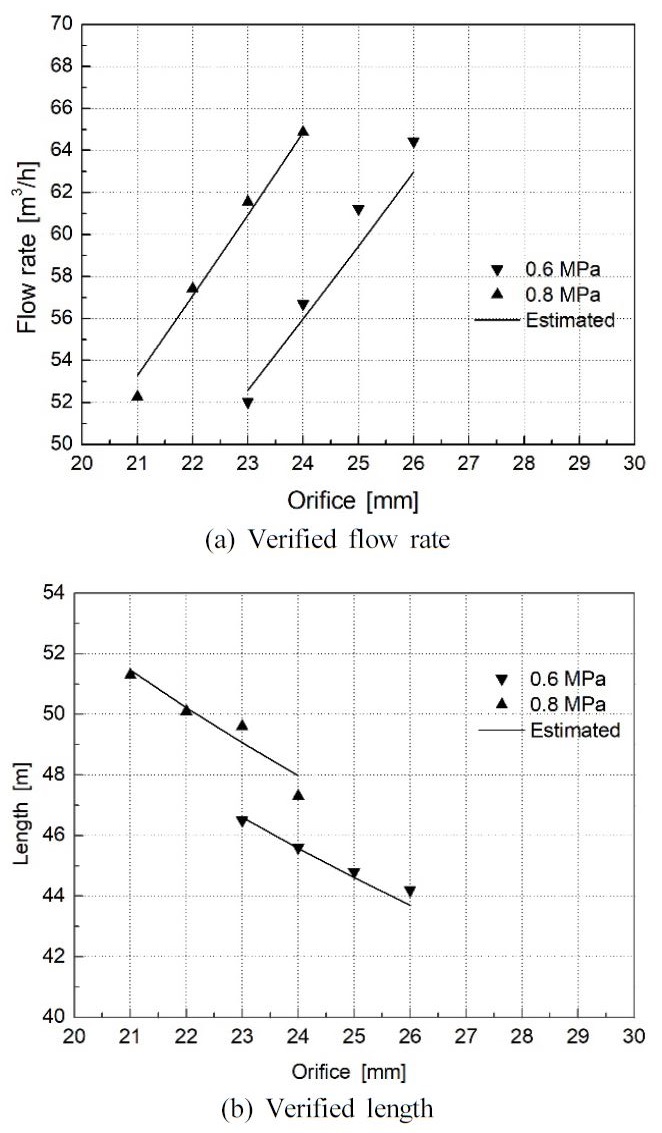
To verify the predictive performance of the selected parameters, additional numerical computations were performed and the simulation results are shown in Fig. 4; the conditions of nozzle diameter and operating inlet pressure are listed in Table 6.
| (1) |
3. Evaluation function design and optimization
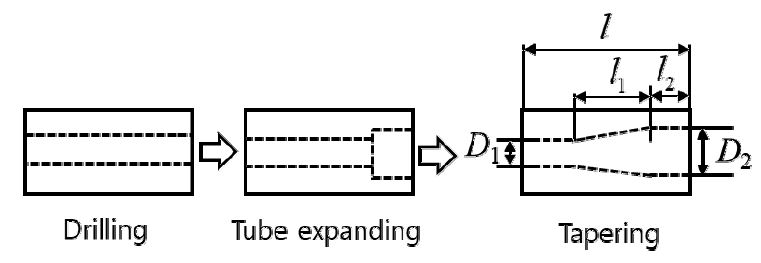
In this paper, an optimal design method that considers the performance and productivity of the mobile monitor was proposed. To define the productivity, the production process of the nozzle was considered as drilling, tub expanding, and tapering as shown in Fig. 5.
As the main process dimension is the parameter associated with the spray distance of the mobile monitor, the sufficient consideration is needed. Each production process can be represented as the total production duration and is referred as follows:
| (2) |
Parameters t1 , t2 , and t3 are the drilling, tube expanding, and tapering times, respectively; C1 , C2 , and C3 are the production costs per time for each process; C is the life cycle of the tool; sd is the feed rate; Ct is the tool cost per time; and ad is the depth of cut.
To determine the optimized parameters, the evaluation function related to the performance and productivity should be defined. In this study, the flow rate, spray distance, and production cost were considered for the evaluation function:
| (3) |
where γ1 , γ2 , and γ3 are weighting factors, and Q* , C*p , and L* are the maximum values of flow rate, production cost and spray distance, respectively.
The defined evaluation function should be minimized to find the optimal design parameter of the mobile water monitor and production conditions. To minimize the evaluation function, the DE algorithm was applied [12,13], which is simply represented as follows.
1. Initialize all agents as random positions in the search space.
2. Until a termination criterion is met (e.g., number of iterations performed or adequate fitness reached), repeat the following process:
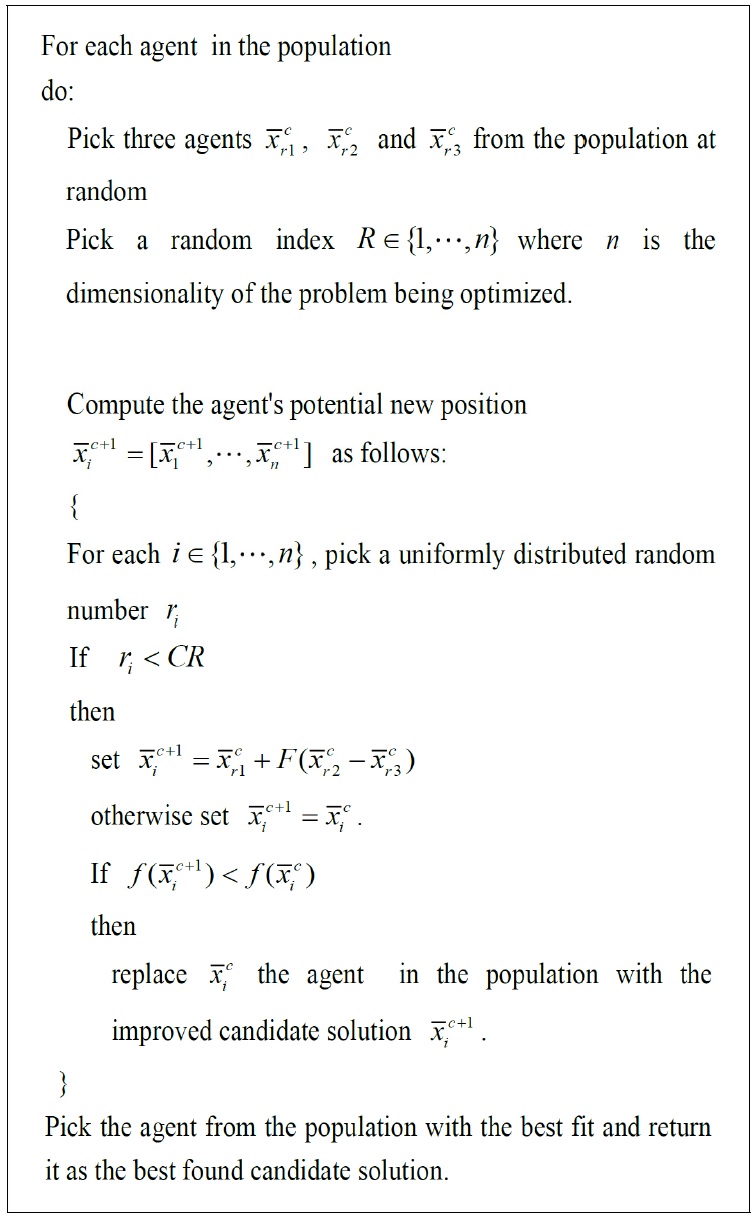
3. The agents for DE are initialized with the number of uniformly distributed random numbers, p, as follows:
| (4) |
where i=1, 2, ⋯, pn and (j =1, ⋯, 10) are states P, D1, l1, l2, sd, and ad of the current generation.
4. The offspring is generated through mutation of three randomly selected parents. The mutation operation is as follows:
| (5) |
where represents offspring generation; are randomly selected parents, and F(0 < F < 1) is the operating parameter.
5. After the mutation operation, a recombination operation was performed to secure the diversity of population. The recombination operation shuffles with constant probability as follows:
During the optimization of the evaluation function, the machining constraints were considered as follows: depth of cut [mm] is 0.1 < ad < 2, feed rate [mm/s] is 0.1 < sd < 35, and length of tube [mm] is 10 < l1 and l2 < 120.
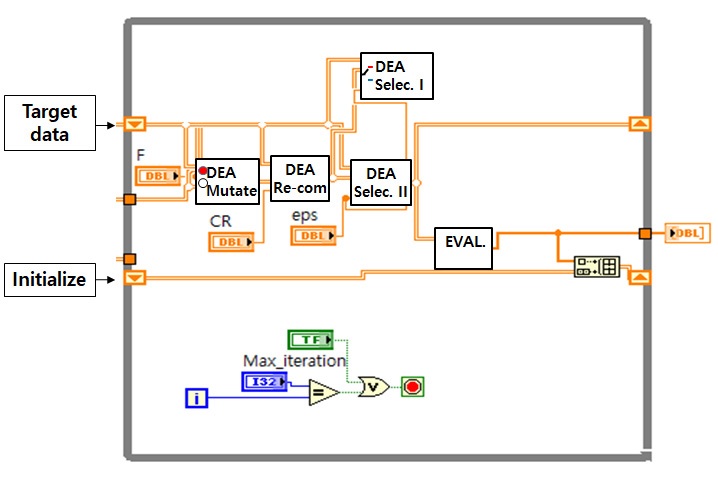
In addition, the spray distance (Lest) is longer than 40 m and the flow rate (Qest) is less than 60 m3/h. The proposed optimal method was implemented using LabView software, as shown in Fig. 6. The initialized agents were selected as 120 candidate values, and the optimized results are summarized in Table 7, where the optimized the flow rate is 60.89 m3/h for the spray distance of 49.18 m.
4. Conclusion
In this study, the performance function of the mobile water monitor system was developed and was used to numerically determine the optimal design parameters. The proposed performance function was induced based on the revised SOLAS regulation. The design constraint was defined over 60 m3/h of the flow rate and a spray distance of ≥40 m within a discharge pressure of 0.4-0.9 MPa. During the design of the mobile water monitor, its performance as well as productivity was carefully considered. Accordingly, the production process was defined and the evaluation function for production cost was induced. The proposed performance and productivity function was used to select the optimal design parameters such as the nozzle size and machining conditions. In order to optimize the proposed evaluation function the DE algorithm was applied and the machining condition and nozzle size for the monitor were induced. Based on the optimized result, the numerical simulation was carried out and the results showed a flow rate and spray distance of 60.89 m3/h and 49.18 m. These simulated values satisfied the SOLAS regulation and can save approximately 37% of cost compared to those of the existing production conditions. The proposed algorithm can be used as the guide line to design the mobile water monitor which consider the performance and productivity. Although the performance of the proposed optimization method was verified analytically, its productivity and performance should be experimentally verified in the future.
Acknowledgments
This work was supported by Dong-A University research fund.
References
- American Bureau of Shipping, 2016, Fighting Fire on Container ships, < https://ww2.eagle.org/en/Products-and-Services/marine/containerships.html, >.
-
Lee, D. H., Paika, J. K.,Seo, J. K., 2018, Efficient Water Deluge Nozzles Arrangement on Offshore Installations for the Suppression of Pool Fires, Ocean Engineering, 167 293-309.
[https://doi.org/10.1016/j.oceaneng.2018.08.038]

-
Alhaza, T., Alsadoon, A., Alhusinan, Z., Jarwali, M., Alsaif, K., 2015, New Concept for Indoor Fire Fighting Robot, Procedia - Social and Behavioral Sciences, 195:3 2343-2352.
[https://doi.org/10.1016/j.sbspro.2015.06.191]

-
Liang, T., Lob, S., Wang, X., Liao, G., 2012, A Numerical study of the Fire-extinguishing Performance of Water Mist in an Opening Machinery, Space Procedia Engineering, 31 734-738.
[https://doi.org/10.1016/j.proeng.2012.01.1094]

-
Kang, H. J., Choi, J., Lee, D., Park, B. J., 2017, A Framework for Using Computational Fire Simulations in the Early Phases of Ship Design, Ocean Engineering 129:1 335-342.
[https://doi.org/10.1016/j.oceaneng.2016.11.018]

-
Kang, H. J., Kim, I., Choi, J., Lee, G. J., Park, B. J., 2018, A Concept Study for the Buoyancy Support System Based on the Fixed Fire-fighting System for Damaged Ships, Ocean Engineering, 155 361-370.
[https://doi.org/10.1016/j.oceaneng.2018.02.040]

-
Li, W., Liu, M., Wang, J., Chong, D., 2018, Exergy Analysis of Centered Water Nozzle Steam-water Injector, Experimental Thermal and Fluid Science, 94 77-88.
[https://doi.org/10.1016/j.expthermflusci.2018.01.038]

-
Essien, S., Archibong, E. A., Lao, L., 2019, Discharge Coefficient of High Viscosity Liquids Through Nozzles, Experimental Thermal and Fluid Science, 103 1-8.
[https://doi.org/10.1016/j.expthermflusci.2019.01.004]

-
Tang, C., Feng, Z., Zhan., C., Ma, W., Huang, Z., 2017, Experimental Study on the Effect of Injector Nozzle K Factor on the Spray Characteristics in a Constant Volume Chamber: Near Nozzle Spray Initiation, the Macroscopic and the Droplet Statistics, Fuel, 202 583-594.
[https://doi.org/10.1016/j.fuel.2017.04.078]

-
Baylar, A., Aydin, M. C., Unsal, M., Ozkan, F., 2009, Numerical Modeling of Venturi Flows for Determining Air Injection Rates Using FLUENT V6.2, Mathematical and Computational Applications, 14:2 97-108.
[https://doi.org/10.3390/mca14020097]

-
Raoult, F. Lacour, S. Carissimo, Trinquet, B. F., Delahaye, A., Fournaison, L., 2019, CFD Water Spray Model Development and Physical Parameter Study on the Evaporative Cooling, Applied Thermal Engineering, 149 960-974.
[https://doi.org/10.1016/j.applthermaleng.2018.12.063]

-
Babu, B. V., Jehan, M. M. L., 2003, Differential Evolution for Multi-objective Optimization, In Proceedings of the IEEE Congress on Evolutionary Computation Canberra Australia, 4 2696-2703.
[https://doi.org/10.1109/CEC.2003.1299429]

-
Krishna, A. G., 2007, Selection of Optimal Conditions in the Surface Grinding Process Using a Differential Evolution Approach, Journal of Engineering Manufacture, 221:7 1185-1192.
[https://doi.org/10.1243/09544054JEM736]

