
CUDA 병렬 Order-Domain 특징량 추출을 이용한 전기차 감속기 기어 제조 품질 검사
Abstract
Electric vehicle reducer gears directly affect drivetrain noise, vibration, and harshness; furthermore, manufacturing-related anomalies must be inspected before their assembly. This study proposes a CUDA-parallel order-domain feature-extraction framework for the manufacturing quality inspection of electric-vehicle reducer gears under variable-speed dynamic meshing conditions. Speed-pulse signals are used to reconstruct the shaft angle, and vibration signals are transformed into the order domain through computed order tracking. Sixteen physically interpretable features are extracted from the gear meshing orders, ghost orders, order-band energies, and angle-domain statistics. The proposed method is evaluated using 640 DMTD samples featuring five gear states. File-level stratified cross-validation indicates macro-F1 scores of 0.9936 and 0.9886 for acceleration and deceleration conditions, respectively. The CUDA implementation yielded speedups of 45.9× for angular resampling, 49.7× for feature extraction, and 5.40× for overall computation (excluding I/O).
Keywords:
Electric vehicle reducer gear, Manufacturing quality inspection, Computed order tracking, Order-domain feature extraction, CUDA parallel computing, NVH1. 서 론
전기차에서는 내연기관의 소음 masking 효과가 작기 때문에 감속기 기어의 치합에서 발생하는 진동 및 whine noise가 차량 전체의 NVH(noise, vibration, harshness) 성능에 직접적인 영향을 미친다. 특히 기어 연삭 과정에서 발생하는 tooth surface waviness, ghost order, slight bump 및 leaky grinding과 같은 제조 관련 이상은 조립 이후 감속기의 소음 문제로 이어질 수 있다. 따라서 완성차 및 부품 제조 관점에서는 기어가 조립되기 전 단계에서 제조 품질과 NVH 위험성을 빠르게 판정할 수 있는 검사 기술이 중요하다.
기존의 단일 기어 치면 형상 및 Fourier 측정 기반 검사는 정밀한 치면 정보를 제공하지만, 검사 시간이 길고 실제 동적 치합 조건에서의 성능을 완전히 대표하기 어렵다. Dynamic Meshing Transmission Dataset (DMTD)은 이러한 한계를 보완하기 위해 전기차 감속기 기어쌍의 동적 치합 진동 및 속도 펄스 신호를 실제 산업 환경에서 수집한 데이터셋이다[1]. DMTD는 정상 기어뿐 아니라 40th ghost order whine, 62nd ghost order whine, slight bump, leaky grinding 등 제조 공정에서 발생할 수 있는 4가지 이상 상태를 포함한다.
가변속 회전기계에서 결함 성분은 Hz 단위 주파수 축에서 시간에 따라 이동하므로, 일반적인 시간-주파수 분석만으로는 기어 치합과 동기화된 성분을 안정적으로 비교하기 어렵다. Computed order tracking(COT)은 속도 신호를 이용하여 시간 영역 신호를 회전각 기준 신호로 변환하고, 축 회전수의 배수인 order domain에서 진동 성분을 분석하는 방법이다[2]. 본 연구는 DMTD의 speed pulse 신호와 vibration 신호를 이용하여 COT 기반 order-domain 특징량을 구성하고, 이를 전기차 감속기 기어 제조 품질 분류 문제에 적용한다.
본 연구의 주요 기여는 다음과 같다. 첫째, 가속 및 감속 조건에서 수집된 EV 감속기 기어 진동 신호에 대해 speed pulse 기반 COT pipeline을 구성하고, gear meshing order 및 ghost order를 반영한 16차원 해석 가능 특징 벡터를 정의하였다. 둘째, 파일 단위 stratified cross-validation을 적용하여 data leakage를 방지한 조건에서 order-domain 특징량의 제조 품질 판별력을 검증하였다. 셋째, 각도 재샘플링, windowing, batched FFT 및 order-domain 특징량 추출 과정을 CUDA C로 병렬화하고, Serial C 구현과의 처리 시간 및 수치 일치성을 정량적으로 평가하였다.
2. 데이터셋 및 문제 정의
2.1 DMTD 데이터셋 구성
본 연구에서는 DMTD 중 CSV 형식으로 제공되는 640개 파일을 사용하였다. 각 파일은 약 24초 길이의 vibration signal과 speed pulse signal을 포함하며, sampling rate는 fs = 12,800 Hz이다. 각 파일은 채널당 307,224개의 샘플로 구성되며, speed pulse signal의 pulses per revolution은 이다. 데이터는 acceleration(100 → 2450 r/min) 및 deceleration(2450 → 100 r/min) 조건에서 취득되었고, 정상(healthy)과 네 가지 제조 이상(40th ghost order whine, 62nd ghost order whine, slight bump, leaky grinding)을 포함한다.
Table 1에서 확인할 수 있듯이 데이터셋은 클래스 불균형을 가진다. 정상 클래스는 264개 샘플을 포함하는 반면, slight bump 및 leaky grinding 클래스는 각각 34개 샘플만을 포함한다. 본 연구에서는 이러한 불균형을 고려하여 accuracy 외에도 balanced accuracy, macro-averaged F1-score 및 per-class recall을 함께 사용한다.

Number of CSV samples for each gear class and operating condition
2.2 문제 정의
본 연구의 입력은 파일 i에 포함된 vibration signal ai[n]과 speed pulse signal pi[n]이다. 목표는 각 파일에 대해 class label yi를 예측하는 것이다. 이때 원시 신호를 직접 분류하기보다, COT를 통해 order-domain spectrum Ai(o)를 계산하고, 기어 치합 및 제조 이상과 관련된 해석 가능한 특징 벡터 zi를 추출한 뒤 표준 분류기 g(ㆍ)에 입력한다.
| (1) |
3. 제안 방법
3.1 Computed Order Tracking Pipeline
Speed pulse signal pi[n]에서 threshold를 기준으로 rising edge를 검출한다. 서브샘플 정밀도 확보를 위해 threshold crossing 시각은 선형 보간으로 계산한다. i번째 pulse edge의 시각을 ti라고 하면 해당 축 각도는 식 (2)와 같다.
| (2) |
Angular resampling을 위해서는 균일 각도 grid θι에 대응하는 시각 t(θι)가 필요하다. 따라서 본 연구에서는 sparse knot pair에 대해 자연 3차 spline을 구성하여 inverse angle-time mapping t(θ)를 계산하였다.
| (3) |
균일 각도 grid는 Nθ = 512 samples/rev로 설정하였다. 각 grid point θι는 식 (4)와 같이 정의된다. 이후 t(θι)에 해당하는 원시 vibration sample index를 계산하고, 시간 영역에서 선형 보간을 수행하여 angle-domain signal을 얻는다.
| (4) |
| (5) |
3.2 Order Spectrum Calculation
Angle-domain signal은 Nrev = 16 rev/window 단위로 분할되며, 50% overlap을 적용한다. 각 window에는 Hann window를 적용한 후 FFT[3]를 수행한다. Order-bin spacing은 식 (6)과 같고, Nrev = 16 일 때 Δo = = 0.0625 order이다. FFT 결과 X[k]로부터 order spectrum amplitude A[k]를 식 (7)과 같이 계산한다.
| (6) |
| (7) |
Order는 진동 성분의 주파수 f를 축 회전주파수 fr로 정규화한 o = 로 정의된다. 본 데이터셋의 pinion은 27개의 치를 가지므로 축이 1회전하는 동안 27회의 치합이 발생하며, 기본 gear meshing frequency는 fmesh = zpfr로 표현된다. 따라서 fundamental gear meshing order는 omesh = = zp = 27이다. 실제 치합력, 치합강성 및 transmission error의 시간 파형은 완전한 정현파가 아니므로 기본 치합 order의 정수배 고조파가 발생하며, 54차와 81차 order는 각각 second 및 third gear-meshing harmonics에 해당한다.
반면 ghost order는 기어 치수로 결정되는 정상 치합 order와 일치하지 않는 추가적인 order 성분으로, 연삭 공정의 주기적 운동이나 치면 waviness와 같은 제조 오차에 의해 유발될 수 있다. DMTD에서는 40차 및 62차 order 성분과 관련된 whine 이상을 각각 별도의 결함 클래스로 정의하고 있으므로[1], 본 연구에서는 해당 order를 결함 특이적 특징량으로 선택하였다. 또한 각 target order 주변의 band energy는 유한한 window 길이, 미세한 속도 변동 및 spectral leakage에 의해 에너지가 인접 bin으로 분산되는 영향을 완화하기 위해 함께 사용하였다.
이상의 이론적 근거와 DMTD의 결함 정의를 바탕으로 target order set을 식 (8)과 같이 정의하였다. 여기서 27은 fundamental gear meshing order, 54와 81은 각각 second 및 third gear-meshing harmonics이며, 40과 62는 DMTD에서 보고된 ghost-order whine 성분이다.
| (8) |
3.3 Order-Domain Feature Vector
각 window에서 target order amplitude, order-band energy, ghost order ratio, high-order energy ratio 및 angle-domain 통계량을 추출한다. Table 2는 본 연구에서 사용한 16차원 특징 벡터의 정의를 나타낸다. 주요 특징량은 A(27), A(40), A(54), A(62), A(81), E(27), ..., Rghost, Rhigh 및 RMS, Peak, Kurtosis, Crest factor이다.
Definition of the 16-dimensional order-domain feature vector
파일 i의 번째 window에서 추출된 특징 벡터를 zi,w라 하면, 파일 단위 특징 벡터는 window 평균으로 정의하였다. 이 파일 단위 집계는 동일 파일에서 유래한 window들이 학습 및 평가 fold에 동시에 포함되는 것을 방지하기 위한 data leakage 방지 전략과도 연결된다.
| (9) |
3.4 CUDA Parallel Implementation
제안한 pipeline에서 가장 큰 반복 연산은 angular resampling, windowing, FFT 및 feature extraction 단계에서 발생한다. 본 연구에서는 이 계산을 CUDA C와 cuFFT[5]를 이용하여 병렬화하였다. Serial C 기준 구현에서는 FFTW[4] 단정밀도 FFT 라이브러리를 사용하였다. Edge detection과 spline coefficient 계산은 상대적으로 데이터 양이 적고 순차 의존성이 크므로 CPU에서 수행하고, 이후의 angle-domain resampling, batched FFT 및 feature extraction은 GPU에서 병렬 수행하였다. Table 3은 각 pipeline 단계별 병렬화 단위와 구현 방식을 요약한다.
Parallelization strategy for the CUDA implementation
CPU와 GPU 구현의 수치 일치성은 식 (10)의 상대 오차 기준으로 평가하였다. 모든 파일과 모든 특징량에 대해 ek < τ 를 만족하면 CPU-GPU 수치 일치성이 확보된 것으로 판단하였다.
| (10) |
4. 실험 방법
가속 조건과 감속 조건은 서로 다른 동적 응답을 가질 수 있으므로 본 연구에서는 두 조건을 분리하여 각각 분류 실험을 수행하였다. 각 조건별로 stratified 5-fold cross-validation을 적용하였으며, data leakage를 방지하기 위해 파일 단위로 fold를 구성하였다. 즉, 한 파일에서 추출된 모든 window 특징량은 먼저 파일 단위로 평균 집계되고, 해당 파일의 대표 특징 벡터만 교차검증 분할에 사용되었다.
특징량은 StandardScaler를 이용하여 평균 0, 표준편차 1로 정규화하였다. 비교 분류기로는 Logistic Regression(LR), radial basis function kernel을 사용한 Support Vector Machine(SVM), Random Forest(RF)[6], Gradient Boosting(GB)을 사용하였다. 평가 지표는 accuracy, balanced accuracy, macro-F1 및 per-class recall로 설정하였다. 모델 선택은 validation fold 평균 macro-F1을 기준으로 수행하였다. 평가 지표로는 accuracy, balanced accuracy, macro-averaged F1-score 및 slight bump 클래스(C3)의 recall을 사용하였다. 클래스 불균형 보정 기법인 SMOTE[7]또는 class-weight 조정은 본 연구의 main experiment에는 적용하지 않았다. 이는 합성 샘플이나 가중치 조정으로 분류 성능을 인위적으로 높이기보다, 물리적으로 해석 가능한 order-domain 특징량 자체의 판별력을 평가하기 위함이다.
5. 실험 결과 및 고찰
5.1 Order-Domain Signal Processing Results
Fig. 1은 대표 샘플들의 가속 및 감속 조건에서의 RPM 프로파일을 보여준다. 두 조건 모두 100~2450 r/min 구간에서 거의 선형적인 속도 변화를 나타내며, 이는 이후 order-domain 변환의 전제가 되는 안정적인 가감속 프로파일이 확보되었음을 의미한다. 클래스별 평균 order spectrum을 비교한 결과(Fig. 2), 40th ghost order whine 클래스에서는 40차 order 성분이 증가하였고, 62nd ghost order whine 클래스에서는 62차 order 성분이 뚜렷하게 증가하였다. Leaky grinding 클래스는 특정 ghost order 하나보다 전체적인 에너지 분포 및 고차 order 에너지 비율에서 다른 클래스와 구분되는 경향을 보였다. 또한 Fig. 3에서 확인할 수 있듯이, Nrev = 8에서는 order 분해능이 낮아 인접 성분이 구분되지 않는 반면 Nrev = 32에서는 분해능은 향상되나 window 내 정상성 가정이 약화될 수 있어, 두 조건을 절충한 Nrev = 16을 최종 window 길이로 채택하였다.
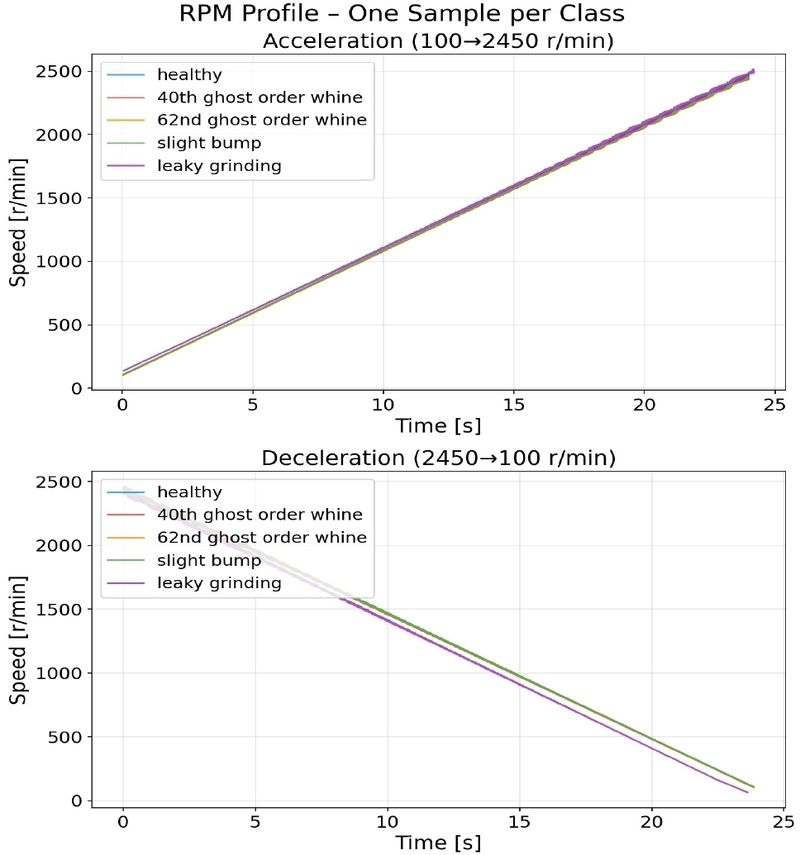
RPM profiles for representative samples under acceleration and deceleration conditions
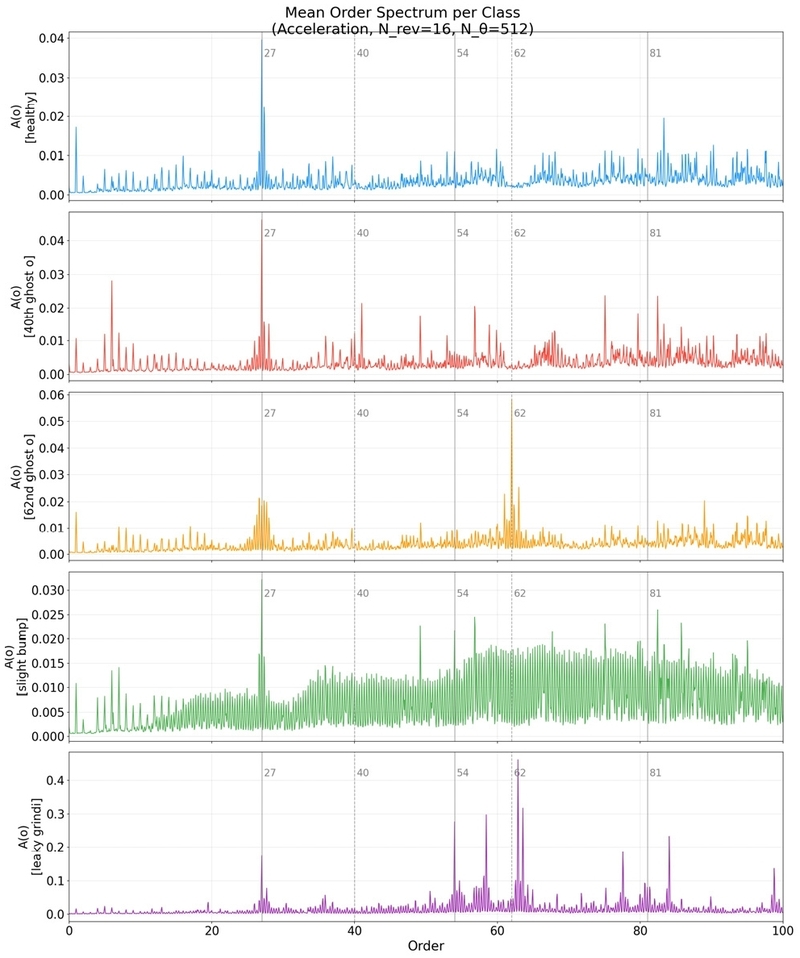
Mean order spectra for the five gear classes under the acceleration condition. Vertical dashed lines indicate the target orders 27, 40, 54, 62, and 81
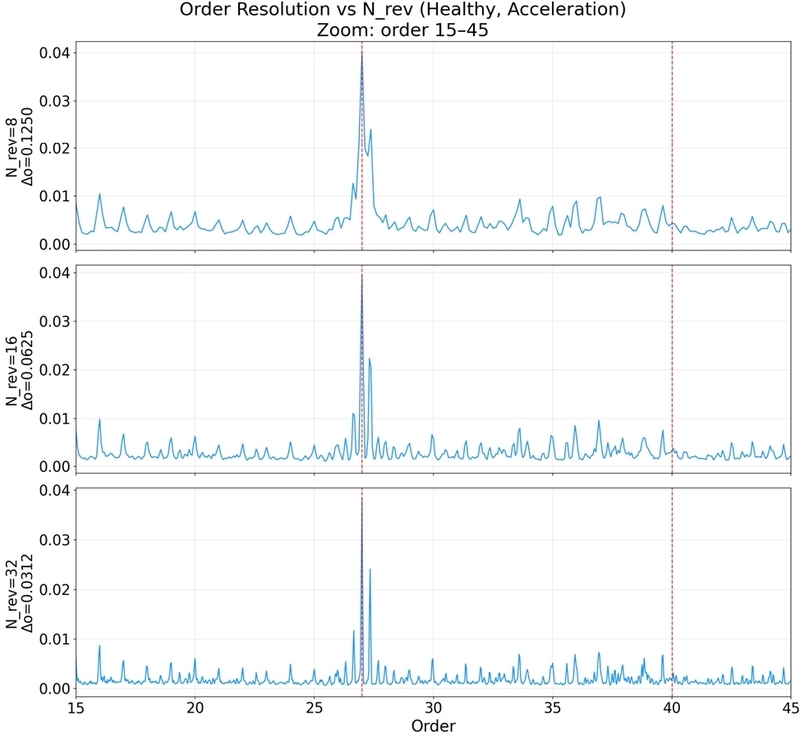
Effect of window length Nrev on order resolution. This figure compares Nrev = 16 with 8 and 32 revolutions around orders 15-45 and supports the choice of Nrev = 16
5.2 Feature Discriminability
Fig. 4와 Table 4에서 확인할 수 있듯이, A(62)는 62nd ghost order whine 클래스에서 정상 대비 약 10.8배 크게 나타나 해당 결함의 강력한 판별자로 작용하였다. 또한 Rghost는 ghost order 계열 결함에서 정상보다 크게 나타났으며, Rhigh는 leaky grinding 클래스에서 현저히 낮아 해당 결함의 고유한 에너지 분포 특성을 반영하였다.
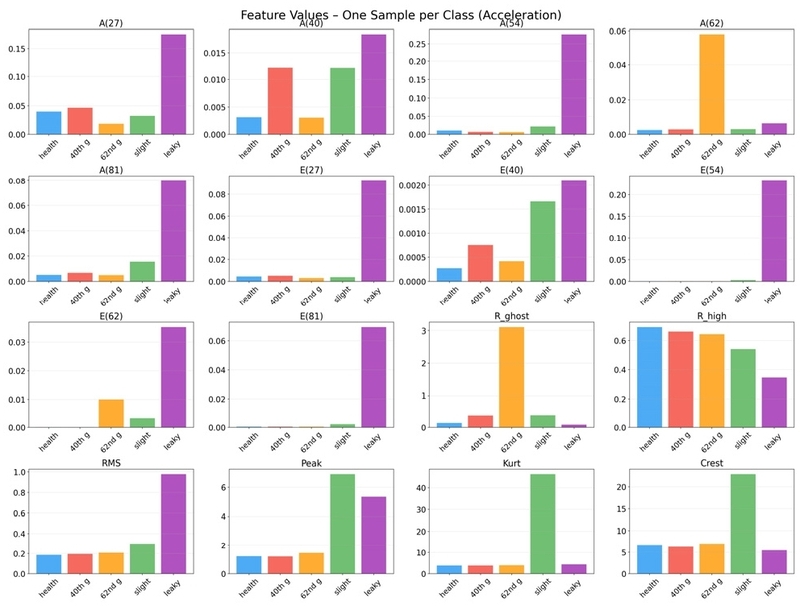
Comparison of the 16-dimensional order-domain feature values for representative samples
Class-wise mean and standard deviation of major features for all 640 samples
5.3 Classification Performance
Table 5에 나타난 바와 같이, 가속 조건에서는 Random Forest가 macro-F1 0.9936±0.0129로 가장 높은 성능을 보였고, 감속 조건에서는 Logistic Regression이 macro-F1 0.9886±0.0065로 가장 높은 성능을 보였다. 감속 조건에서 비선형 앙상블 모델인 RF와 GB가 LR보다 낮은 macro-F1을 기록한 것은, 감속 조건의 더 작은 샘플 수와 소수 클래스 분포 하에서 비선형 모델의 분산이 증가하는 경향에 기인한 것으로 판단된다. 가속 조건에서 LR과 SVM이 동일한 결과를 보인 것은 본 연구에서 정의한 order-domain 특징 공간이 상당히 선형적으로 분리 가능함을 시사한다.
Stratified 5-fold cross-validation classification performance
소수 클래스인 C3(slight bump)는 tooth surface의 국소적 형상 이상에 기인하며, ghost order나 leaky grinding에 비해 order spectrum 상의 에너지 변화가 미약하여 특징 공간에서의 클래스 간 분리도가 상대적으로 낮다. 또한 가속 조건 22개, 감속 조건 12개에 불과한 샘플 수로 인해 fold당 테스트 샘플이 2-5개로 제한되어 recall의 표준편차가 상대적으로 크게 나타났으나, 전체적으로 0.90 이상의 recall을 유지하였다. Fig. 5의 정규화 confusion matrix에서도 두 조건 모두 대부분의 클래스가 대각 성분에 집중되어 있으며, C3(slight bump)가 상대적으로 가장 빈번한 오분류 대상임을 확인할 수 있다. Fig. 6의 Random Forest feature importance 결과는 A(62), Rghost 등 ghost order 관련 특징량이 상위 판별 변수로 작용함을 보여주며, 이는 Table 4에서 관찰된 A(62)의 강한 판별력과도 일치한다.
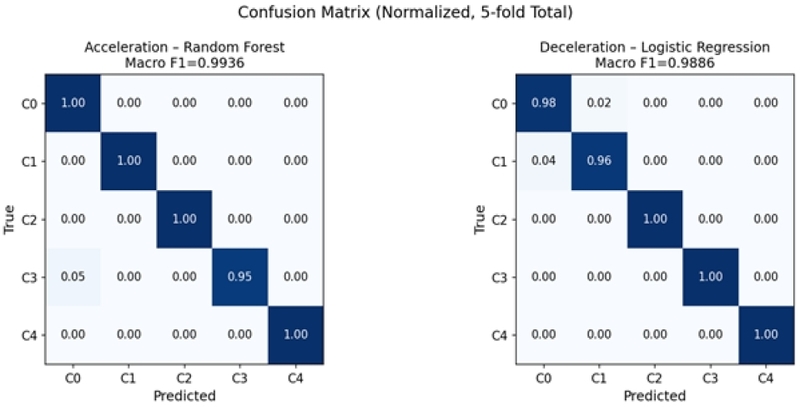
Normalized confusion matrices of the best classifiers
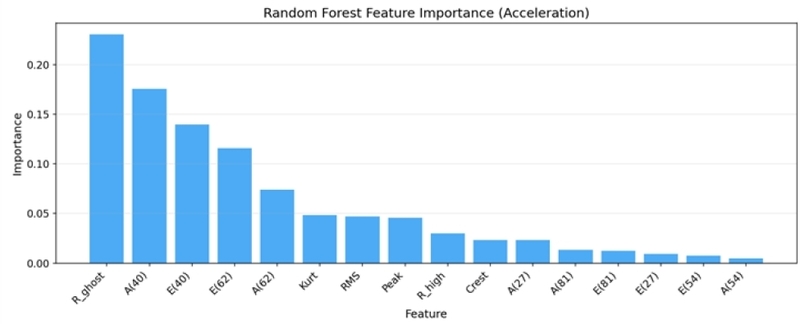
Random Forest feature importance under the acceleration condition
5.4 CUDA Acceleration and Numerical Agreement
Table 6에 나타난 바와 같이, angular resampling과 feature extraction은 각 angle sample, order bin 및 feature band를 독립적으로 처리할 수 있으므로 CUDA에서 큰 kernel-level speedup을 얻었다. 반면 전체 계산 가속비는 edge detection, spline construction, memory transfer 및 cuFFT plan 생성과 같은 직렬 또는 overhead 성분의 영향을 받는다. 특히 전체 가속비는 kernel 가속비보다 작게 나타나며, 이는 Amdahl의 법칙과 일관된다. Table 7은 640개 파일 전체에 대한 16개 특징량의 CPU-GPU 수치 일치성을 정리한 것으로, 모든 특징량에서 최대 상대 오차 1.52×10⁻⁵를 기록하여 허용 기준 τ=10⁻³을 충분히 만족하였다.
Processing time comparison between Serial C and CUDA C for 640 files
CPU-GPU numerical agreement for 640 files and 16 features
파일 로딩 시간을 가속비 산정에서 제외한 이유는 CPU 실험과 GPU 실험이 서로 다른 파일 캐시 상태에서 수행되었기 때문이다. CPU 실행 시에는 파일이 cold cache 상태였으나, GPU 실행 직전에 동일 파일이 이미 접근된 warm cache 상태였으므로, 로딩 시간의 차이는 CUDA 가속의 효과가 아닌 운영체제 페이지 캐시 상태의 차이를 반영한다. 따라서 본 연구에서는 순수 계산 단계의 시간을 기준으로 Serial C와 CUDA C를 비교하였다.
6. 결 론
본 연구는 전기차 감속기 기어의 제조 품질 검사를 위해 speed pulse 기반 computed order tracking과 order-domain 특징량 추출 방법을 구성하고, 이를 CUDA C로 병렬화하였다. DMTD 640개 파일을 대상으로 실험한 결과, 40th 및 62nd ghost order whine은 각각 해당 ghost order 진폭에서 뚜렷한 증가를 보였으며, leaky grinding은 고차 order 에너지 비율에서 다른 클래스와 구분되는 특성을 나타냈다. 이러한 결과는 제안한 16차원 order-domain 특징량이 단순한 분류 입력이 아니라 기어 치합 및 제조 이상과 물리적으로 연결된 해석 가능한 지표임을 보여준다.
파일 단위 stratified 5-fold cross-validation을 적용한 결과, 가속 조건에서는 Random Forest가 macro-F1 0.9936±0.0129, 감속 조건에서는 Logistic Regression이 macro-F1 0.9886±0.0065를 달성하였다. Data leakage를 방지한 조건에서도 높은 분류 성능이 유지되었으며, 소수 클래스인 slight bump에 대해서도 0.90 이상의 recall을 확보하였다. 또한 CUDA 구현은 각도 재샘플링에서 45.9×, 특징량 추출에서 49.7×의 kernel-level speedup을 달성하였고, I/O를 제외한 전체 계산 기준으로는 5.40×의 가속을 보였다. CPU-GPU 특징량 최대 상대 오차는 1.52×10⁻⁵로 허용 기준 10-3 이내였으며, 제안한 병렬 구현의 수치적 신뢰성을 확인하였다.
본 연구의 결과는 다음과 같은 적용 범위와 한계를 가진다. 첫째, 검증은 단일 공개 데이터셋인 DMTD와 해당 데이터셋에 포함된 특정 전기차 감속기 기어 형식을 대상으로 수행되었으므로, 서로 다른 기어 제원, 감속기 구조 및 제조설비에 대한 일반화 성능은 아직 확인되지 않았다. 둘째, 운전 조건은 일정한 속도 기울기를 갖는 가속 및 감속 조건으로 제한되었으며, 부하, 온도, 윤활 상태 및 비정상적인 속도 변동에 따른 영향은 평가하지 않았다. 셋째, 분류 대상은 정상 상태와 네 가지 제조 이상을 포함한 5개 클래스로 제한되며, 일부 결함 클래스의 표본 수가 상대적으로 적다. 따라서 본 연구의 높은 분류 성능은 DMTD에 포함된 시험 조건과 결함 범위 내에서 해석해야 하며, 실제 생산 현장에 적용하기 위해서는 서로 다른 생산 batch, 기어 형상 및 운전 환경에 대한 추가 검증이 필요하다.
향후 연구에서는 더 다양한 생산 batch와 운전 조건으로 검증 범위를 확장하고, 진동 단일 채널 외에 음향 방출, 전류 또는 transmission error와 같은 추가 센서를 융합할 필요가 있다. 또한 생산 라인 적용을 위해 ring buffer 및 CUDA stream 기반 온라인 처리 pipeline으로 확장할 필요가 있다.
References
-
Guo, D., Yang, J., Li, H., Huang, Y., Long, X., Xin, Y., Li, M., 2026, A Dynamic Meshing Transmission Dataset for Manufacturing Quality Inspection of Electric Vehicle Reducer Gears, Sci. Data, 13 510.
[https://doi.org/10.1038/s41597-026-06885-1]

-
Fyfe, K. R., Munck, E. D. S., 1997, Analysis of Computed Order Tracking, Mech. Syst. Signal Process., 11:2 187-205.
[https://doi.org/10.1006/mssp.1996.0056]
-
Cooley, J. W., Tukey, J. W., 1965, An Algorithm for the Machine Calculation of Complex Fourier Series, Math. Comput., 19:90 297-301.
[https://doi.org/10.2307/2003354]
-
Frigo, M., Johnson, S. G., 2005, The Design and Implementation of FFTW3, Proc. IEEE, 93:2 216-231.
[https://doi.org/10.1109/JPROC.2004.840301]
- NVIDIA Corporation, 2026, viewed 27 July 2026, CUDA cuFFF Release 13.4, <https://docs.nvidia.com/cuda/developer-preview/13.4/pdf/CUFFT_Library.pdf, >.
-
Breiman, L., 2001, Random Forests, Mach. Learn., 45 5-32.
[https://doi.org/10.1023/A:1010933404324]
-
Chawla, N. V., Bowyer, K. W., Hall, L. O., Kegelmeyer, W. P., 2002, SMOTE: Synthetic Minority Over-sampling Technique, J. Artif. Intell. Res., 16 321-357.
[https://doi.org/10.1613/jair.953]
Master's Student in the Department of Computer Engineering, Chungnam National University. His research interests include CUDA parallel computing, signal processing, manufacturing data analysis, and vehicle system quality evaluation.
E-mail: dohun1607@unist.ac.kr

Professor in the Department of Computer Engineering, Chungnam National University. His research interests include navigation systems, estimation, signal processing, and computational engineering.
E-mail: sclkim@cnu.ac.kr